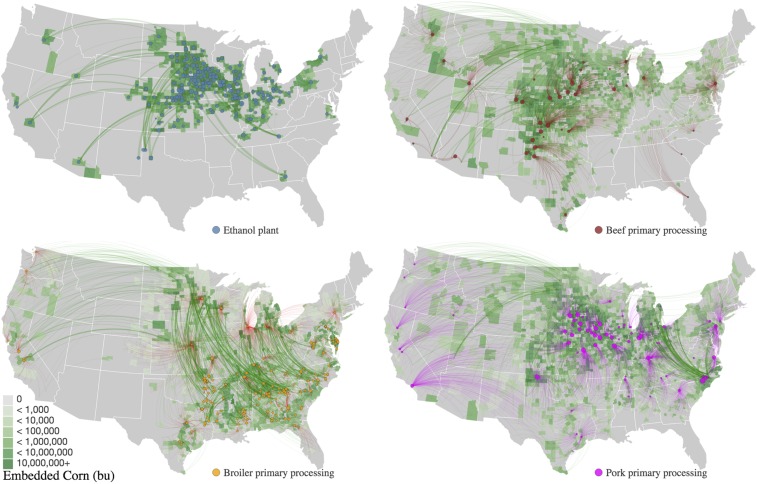
Fig. 3.
The 2012 sector-level corn supply chain connections. Link between corn production and downstream demand: ethanol (stage 1 only) and animal protein processing facilities (embedded corn from stages 1 and 2). Dots represent the location and processing capacity of facilities in each sector. The shaded regions identify the location of quantity of corn sourced for each sector.

