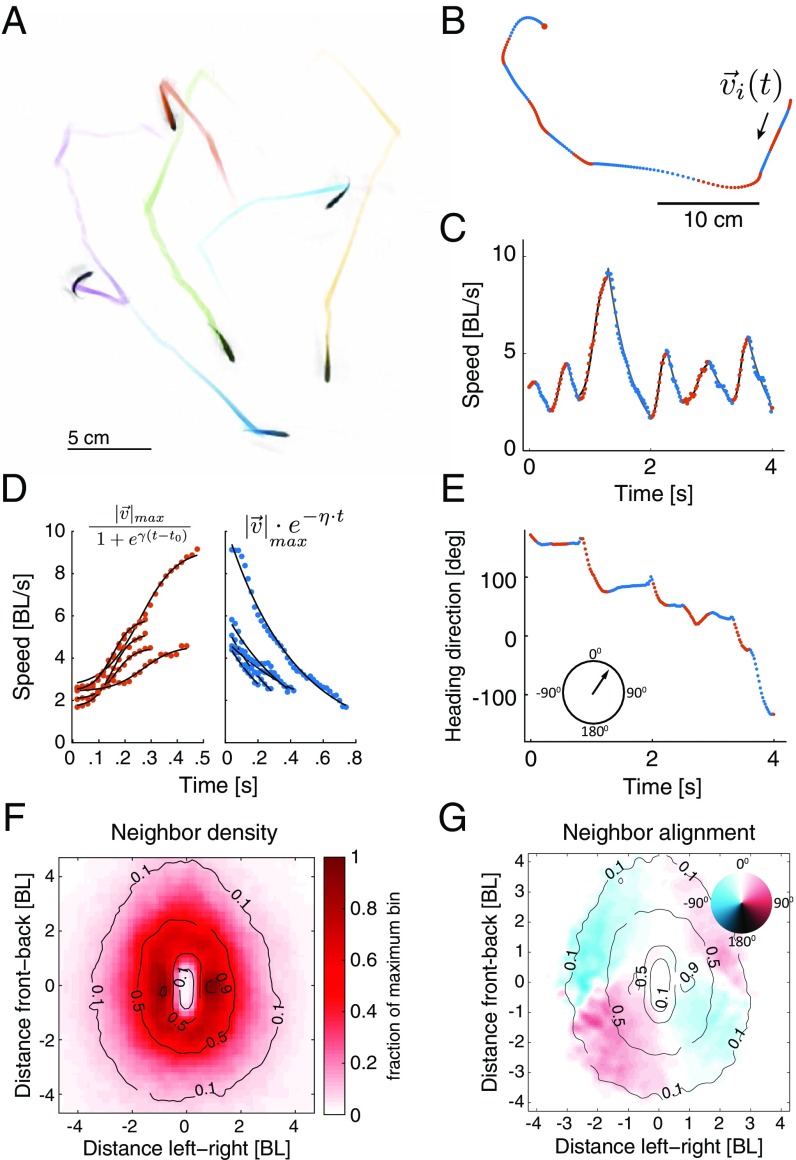
Fig. 1.
Kinematic states of individual fish and group structure. (A) Snapshot of the tracks of six freely swimming fish in the arena. (B) A segment of the swimming pattern of a single fish from the group down-sampled for visualization (dots). Dot colors indicate acceleration (red) or deceleration (blue). (C) Speed profile of the trajectory in B. BL, body length. (D) Functional fits to the acceleration and deceleration epochs in C (SI Materials and Methods). (E) Heading direction vs. time for the segment shown in B (Fig. S1H). (F) Density map of neighboring fish relative to a focal fish situated at [0,0] pointing up. (G) Density map of directional alignment of neighboring fish relative to the direction of motion of the focal fish. The color at each point shows the mean alignment value of fish in that bin, with zero representing perfect alignment (SI Materials and Methods).

