Fig. 3.
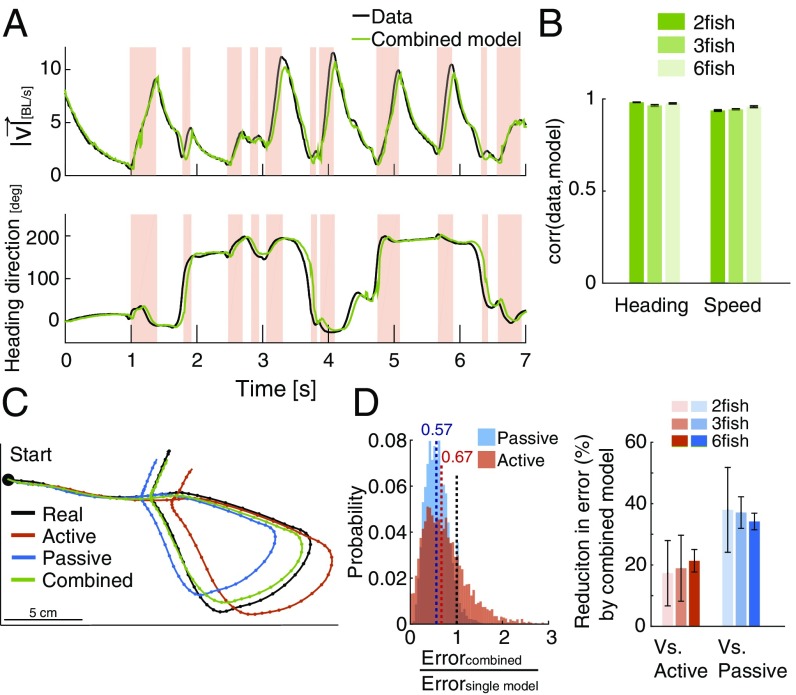
Accurate prediction of velocity and fish trajectory reconstruction. (A) Examples of the measured speed (Upper) and heading direction (Lower) of a single fish in a group of three (black) and the prediction of the combination of the active and passive models, picking the better model at each time point (green). BL, body length. (B) Average correlation between measured speed and heading direction and model predictions for all fish in groups of the same size (error bars = SEM; n = 6, 7, and 7 groups). (C) A short segment (3 s) of the trajectory of a fish in a group of three (black) and the reconstructed trajectory obtained by accumulating the velocity predictions of the active model (red), the passive model (blue), and the optimal combination of the two (green) (SI Materials and Methods). (D, Left) Distribution of the ratio between the reconstruction errors of the combined model and those of the active model or the passive one alone for 5,000 segments similar to the one shown in C. Values below one (black dashed line) represent advantage to the combined model. Colored dashed lines mark the corresponding distribution medians. (D, Right) Average reduction in prediction error of the combined model vs. the active model or the passive model alone for groups of different sizes; error bars represent SD.

