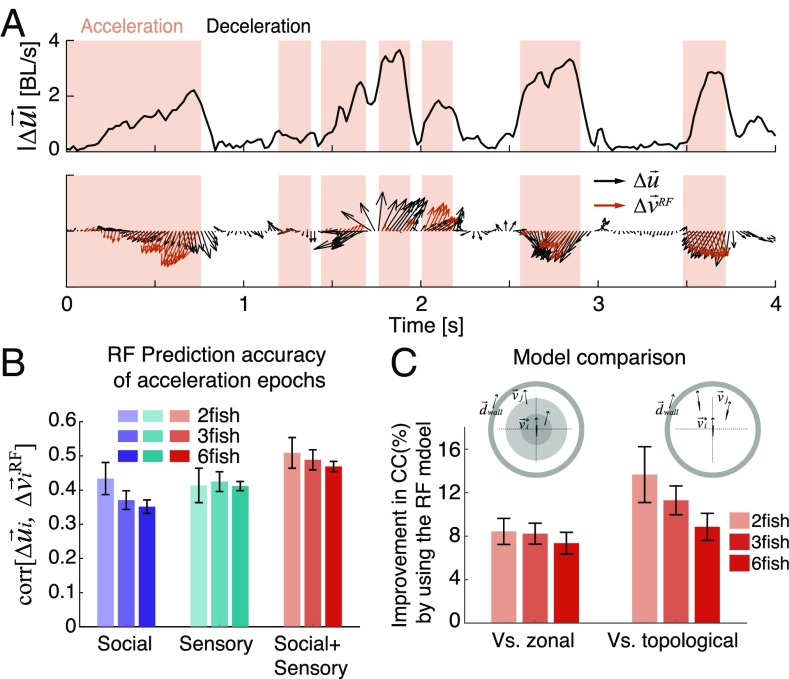
Fig. 4.
Active movement changes are accurately predicted by the RF model using both social and sensory information. (A, Upper) An example of |Δui(t)|, the magnitude of the measured change in velocity after subtracting the passive component (in the text) of a single fish in a group of three over 4 s; background colors mark acceleration epochs (pink) and deceleration epochs (white). BL, body length. (A, Lower) Comparison of the measured Δui(t) and the prediction obtained using the RF model (red arrows) in the acceleration epochs. (B) Prediction accuracy of Δui(t) by RF models that use only the social information component, only the sensory information component, or both components of Eq. 3 for different group sizes (error bars represent SEM; n = 6, 7, and 7 groups). (C) Improvement in predicting Δui(t) in acceleration epochs by the RF model relative to the corresponding zonal or topological versions (SI Materials and Methods has details); values are averaged over all groups of different sizes. CC, correlation coefficient; error bars represent SEM.

