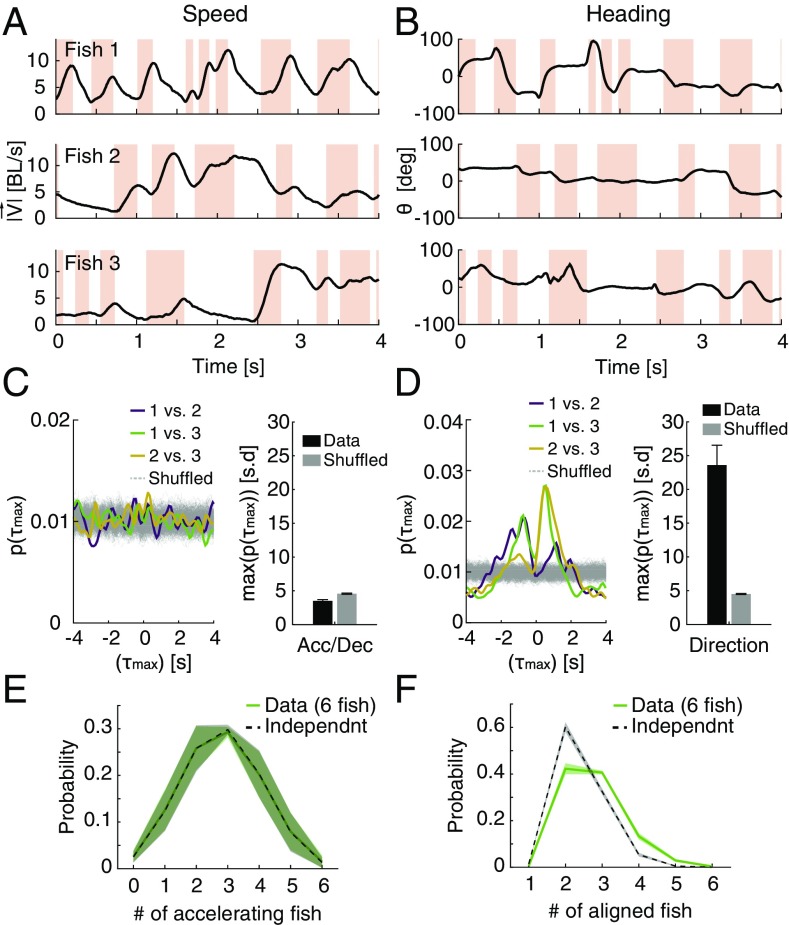
Fig. 6.
Asynchronous switching between information processing modes among individual fish in a group and synchronous heading directions of group members. (A) Example of the simultaneous acceleration (pink)/deceleration (white) profiles of three fish in a group. BL, body length. (B) Same as in A but for the heading direction of the fish. (C, Left) Distributions of time difference (τmax) that gave the maximum correlations between the kinematic states of pairs of fish for 1-s-long windows in a group of three (colored lines) and shuffled controls (light gray) (SI Materials and Methods). (C, Right) Peak values of the distribution of time difference (τmax) shown in C, Left in units of SDs for pairs of fish and for shuffled data averaged over all pairs of fish within all groups of three fish (n = 6, P = 0.99, t test for matched samples). (D) Same as in C but for the distribution of time difference (τmax) of the cross-correlation of direction of motion of pairs of fish. Here, directional correlation shows clear structure and peak times (n = 6, P < 0.0005, t test for matched samples). (E) Average empirical probability distribution P(a1, a2, …, an) of fish kinematic states (acceleration or deceleration), where ai represents the state of fish i (solid green), and the prediction of a model assuming independence between fish p(a1)p(a2) … p(an) (dashed line); shadings represent SEM. (F) Similar to E for the distribution of heading direction P(d1, d2, …, dn), where di is the direction of fish i discretized into six evenly sized bins (SI Materials and Methods) (solid green), and the distribution obtained under the assumption of independence p(d1)p(d2) … p(dn) (dashed line).

