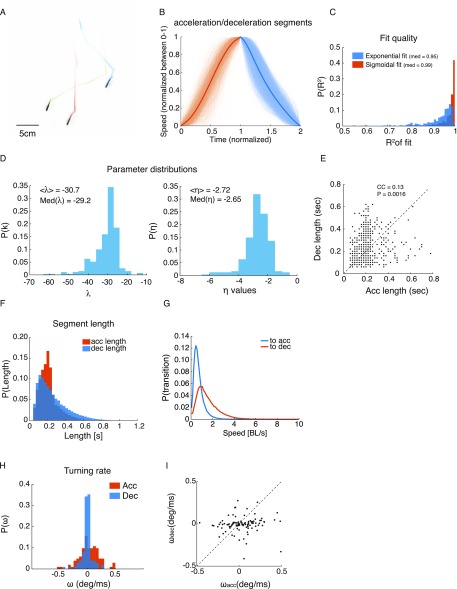
Fig. S1.
Kinematic states of individual fish in a group. (A) A snapshot of the tracks of three fish. (B) All acceleration and deceleration epochs for a single fish over 5 min of swimming, with time normalized between zero and two (one marks the transition from acceleration to deceleration) and speed normalized between zero and one. Bold lines are the means over all epochs. (C) Distributions of values for all of the segments shown in B, with median values of for accelerations and for decelerations representing high model fit accuracies. (D) Fitted parameters for accelerations (Left) and decelerations (Right). Sigmoid slope shows that a distribution peaked around and that a friction coefficient peaked around . (E) Duration of successive acceleration and deceleration epochs (shown in B) plotted one against the other shows a very weak linear relationship between the two [Pearson’s correlation coefficient (CC) = 0.13, P = 0.0016]. (F) Distributions of acceleration and deceleration durations for all fish in all groups. Acceleration epochs had a mean duration of and were generally shorter than decelerations with a mean duration of . (G) Probability of switching states as a function of swimming speed. As can be expected, the probability of switching from deceleration to acceleration is higher for low-speed values, with a peak at 0.45 body lengths (BLs)/s, a narrow distribution (middle 95% of the distribution between 0.05 and 1.85 BLs/s), while switching back to deceleration is peaked at 1 BLs/s, with a much wider distribution (middle 95% of the distribution between 0.2 and 4.15 BL/s). (H) Distributions of the angular velocity , with being the heading of the fish, for the acceleration and deceleration epochs shown in B. Note the narrow distribution centered around zero for decelerations. (I) Angular velocity of successive acceleration and deceleration epochs. No clear relationship seems to exist between successive epochs.

