Fig. S3.
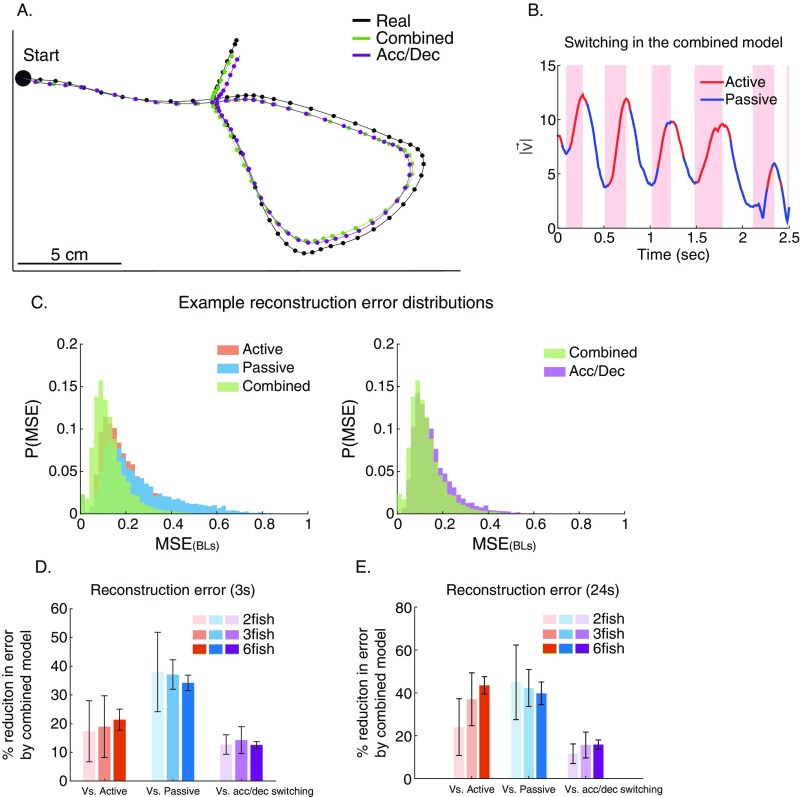
Switching in the combined model is comparable with the kinematic state of the fish. (A) The trajectory segment from Fig. 3C (black) and the predicted trajectory using the optimal combination of the two models (green) overlaid with the predicted trajectory based on switching between models that is done according to the acceleration or deceleration state of the fish (purple). (B) An example of the optimal switching between models in the reconstruction shown in Fig. 3C and A (green line) and their high correspondence to the acceleration/deceleration state of the fish (pink background represents accelerations). (C, Left) Example distributions of the reconstruction error using the combined model (green) compared with the active (red) and passive (blue) models. BLs, body lengths. (C, Right) Comparison of the combined model (green) with switching according to the acceleration/deceleration state of the fish (purple). (D) Average reduction in the reconstruction error of the combined model compared with the active model alone (red), the passive model alone (blue), and the prediction obtained by switching according to the acceleration/deceleration state of the fish (purple). Error bars represent SD. (E) Similar to D only for reconstruction of longer trajectory segments (24 s), giving highly similar results.

