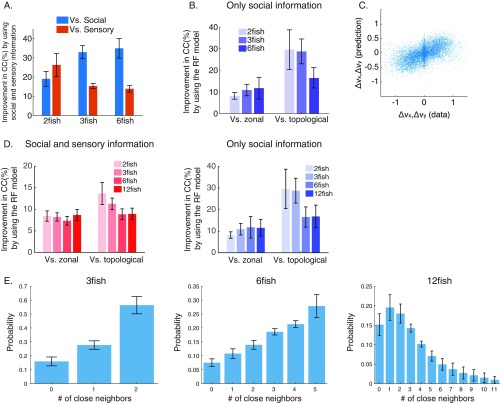
Fig. S4.
Active movement changes are accurately predicted by the RF model using both social and sensory information. (A) Improvement in prediction accuracy (CC, correlation between data and model) of the RF model using both social and sensory information compared with the social information alone (blue) and sensory information alone (red) for all group sizes (n = 6, 7, and 7; error bars represent SEM). (B) Improvement in prediction accuracy by using the RF model compared with the zonal and topological models when using only sensory information for prediction for all group sizes (n = 6, 7, and 7; error bars represent SEM). (C) Predicted velocity components of plotted against their measured values. The linearity and homogeneity of variance across predicted values suggest that we should expect a limited benefit from adding static nonlinearities to our model. (D) Improvement in prediction accuracy by using the RF model compared with the zonal and topological models. Similar to Fig. 4C and B but also including results of 12 fish groups. (E) Averages (and SEM) of the probability to observe 0 to n − 1 neighbors within a distance of six body lengths from a focal individual for groups of 3, 6, and 12 fish (n = 7, 7, and 6, respectively). This distance was used as the upper limit of neighbor interactions in the RF and zonal models. Note the clear difference in the distributions of close neighbors between groups of 12 fish and groups of 3 and 6 fish. It is rare to find zebrafish in cohesive 12 fish groups.

