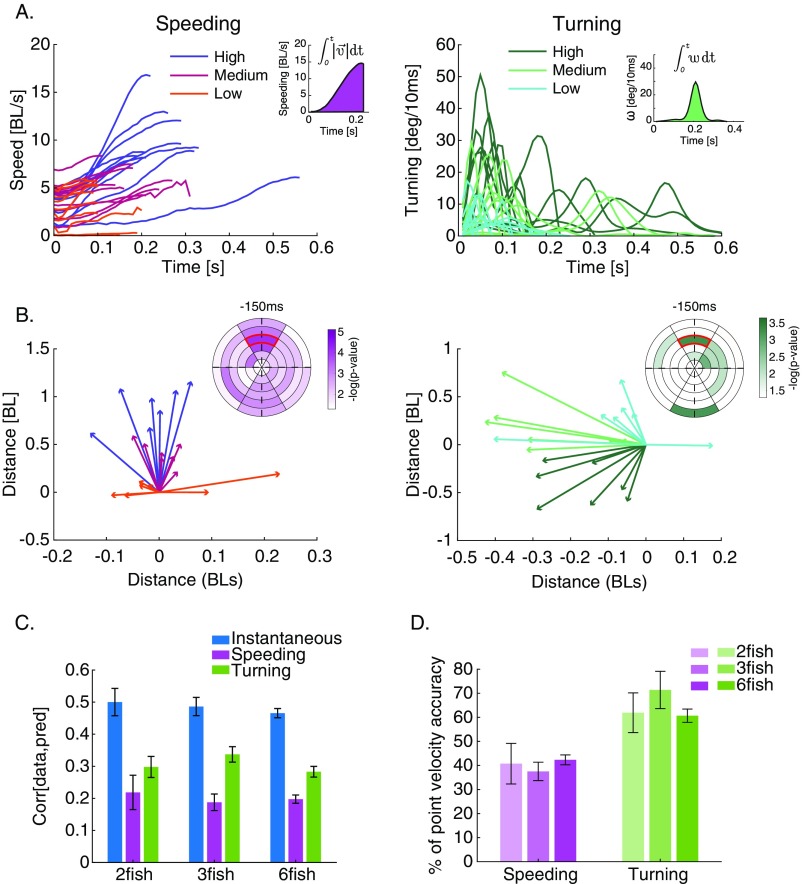
Fig. S5.
Prediction of complete speeding and turning profiles using RF models. (A) Examples of speeding (Left) and turning (Right) profiles (angular velocity) colored by the strength of the response (“low,” “medium,” and “high”), which was determined by discretizing the integrals of responses (Insets) into evenly sized bins. BL, body length. (B, Insets) RF maps showing bins with significantly different neighboring fish behavior before each of the binned responses depicted in A (SI Materials and Methods). (B) Average velocity vectors of the fish in the bin marked in red in B, Insets for different speeding strengths (B, Left) and turning strengths (B, Right); strength is denoted by color as in A. (C) Comparison of the accuracy of prediction for the instantaneous model when predicting (blue) and the accuracy of predicting the complete turning and speeding profiles (purple and green, respectively). Values are average correlation coefficients (n = 6, 7, and 7), and error bars represent SEM. (D) Prediction accuracy of complete turning and complete speeding responses using social and sensory information preceding these events, represented as percentage of the accuracy of predicting point accelerations [] using similar data. Indeed, the ability to predict properties of entire acceleration epoch is significantly lower.

