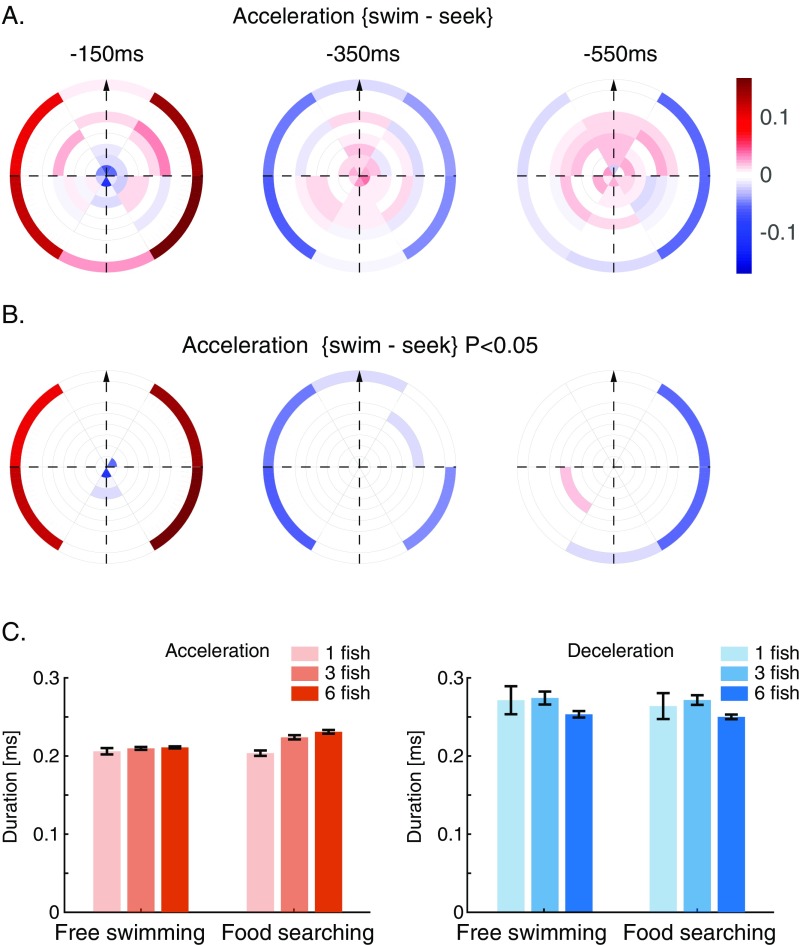
Fig. S6.
RF maps show distinct behavioral state dependencies. (A) Average difference maps of the RF for groups of three fish during acceleration when performing free swimming and food seeking (see above). Bins with weights that were larger in the free swimming state are colored red, and opposite bins are in blue. (B) Same as A but showing only bins with differences that pass a significance test (t test for matched samples, P < 0.05). (C) Average duration of acceleration epochs (Left) and deceleration epochs (Right) in a food-searching task and a free swimming context. Groups of three and six fish show significantly longer accelerations when searching for food, while solitary fish do not exhibit this increase in duration (two-way ANOVA shows significant interaction of size and searching condition comparing groups of either three or six fish with solitary fish, P < 0.02 for both tests). Deceleration epochs show similar durations comparing food-searching and free swimming conditions, although a larger (but consistent) variability exists between the different group sizes (no significant interactions of size and searching condition for groups of either three or six fish compared with solitary fish, P > 0.77 for both). We analyzed the kinematic states of individuals in groups of fish and of solitary fish (from the same batch of experiments) using 16 solitary fish, 10 groups of three fish, and 10 groups of six fish. Food-searching training protocol was the same as the one described in SI Materials and Methods.

