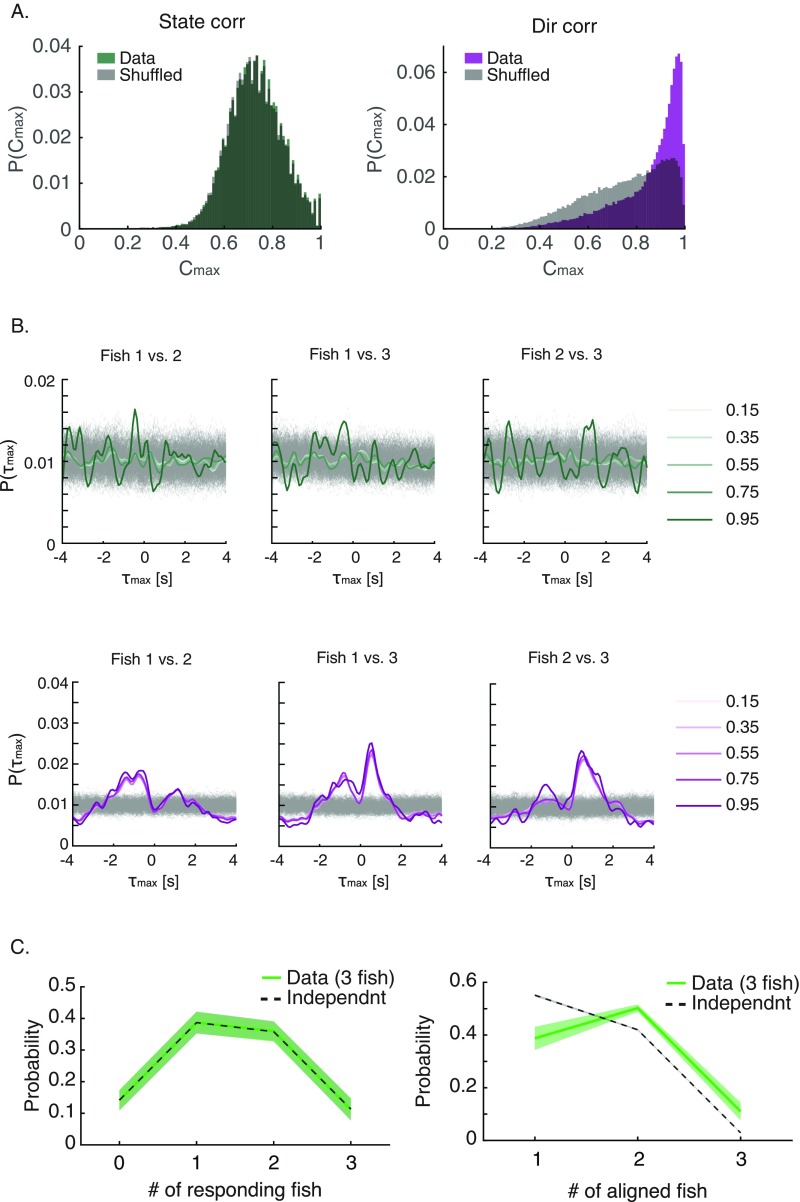
Fig. S7.
Asynchronous switching between information processing modes among individual fish in a group and synchronous heading directions of group members. (A) Distributions of maximal correlation values for a group of three fish (from Fig. 6) for the state correlation analysis (Left) and for the directional correlation analysis (Right) and the correlations obtained using shuffled data in gray (in the text). (B) Distributions of delay time of the maximum correlations between pairs of fish in a group of three (colored lines) and shuffled controls (light gray). Different colors represent different correlation thresholds, where only values corresponding to maximal correlations above these thresholds are used to construct the distributions. For both the state correlation (Upper, green lines) and for directional correlation (Lower, purple lines), using different thresholds does not change the structure of the result presented in Fig. 6. For comparison, shuffled controls are plotted using correlation threshold of 0.95. (C) Group state correlation for groups of three fish, similar to the analysis presented in Fig. 6 E and F for six fish.

