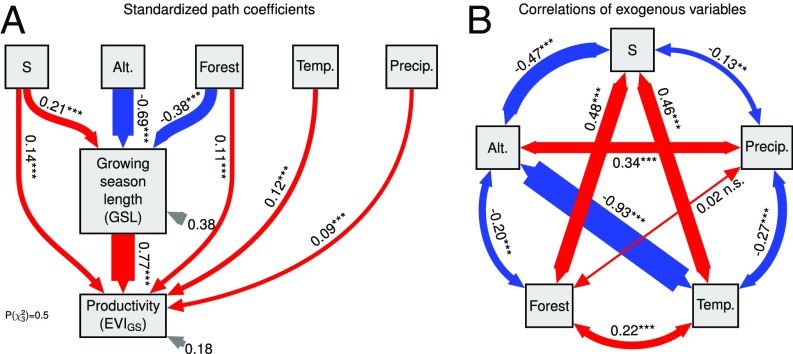
Fig. 5.
Path diagram of effects of biodiversity on productivity (EVIGS) that are mediated by or independent of changes in GSL. The structural equation model accounts for altitude (Alt.), and variables related to land cover and climate. Standardized path coefficients (A) and correlation of exogenous variables (B) are shown separately. Other drivers were tested but removed from the model because they had no statistically significant path coefficients. Gray arrows, residual variances; n = 447; *P < 0.05; **P < 0.01; ***P < 0.001. See Fig. S1 for additional structural equation models including and GSL lengthening. Forest, fraction of plot covered by forest; Precip., annual precipitation; Temp., mean annual temperature.

