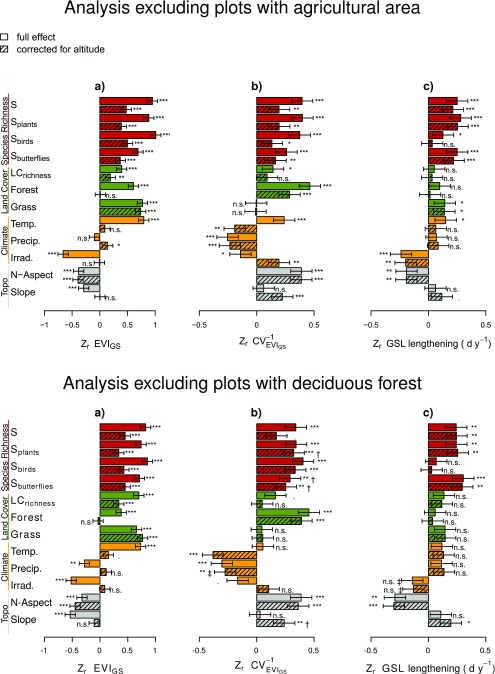
Fig. S2.
Reanalysis of data subsets excluding agricultural land (Upper; n = 254) and deciduous forest (Lower; n = 128): Biodiversity effects on primary productivity (proxy: EVIGS; A), its temporal stability (., B), and the temporal trend of growing season lengthening (GSL-lengthening, C) in the years 2000–2015. These results are very similar to the analysis of the full dataset (cf. Fig. 4). Effect sizes marked with † are derived from models with modeled isotropic (instead of anisotropic) spatial autocorrelation, whereas the ‡ symbol depicts effect sizes from models without considering the spatial autocorrelation. In these cases, models with anisotropic spatial autocorrelation did not converge. See Fig. 4 for further explanations.

