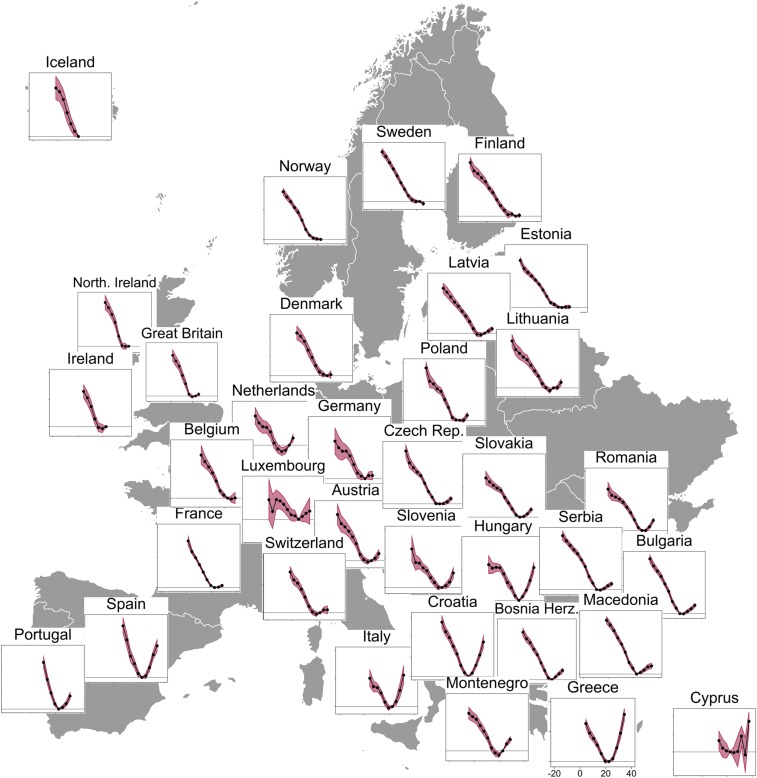
Fig. 1.
Similar temperature responses of daily peak load across countries. Response of daily peak load (y axes, in gigawatts; see SI Appendix, Fig. S1, for a comprehensive overview of each country’s axes scaling) to daily maximum temperature (x axes, between −20 °C and +40 °C) based on observational data for the years 2006–2012. Black dots represent the effect of replacing a day of daily maximum temperature in the omitted category (21 °C–24 °C) with a day of the relevant maximum temperature (see Methods for details). Pink shaded areas denote 95%-confidence band based on Newey–West standard error. Regression functions of all countries display similar characteristics with minimal peak load values at ∼22 °C (71.6 °F) that increase monotonically in lower and higher temperatures, where data coverage is sufficient. Refer to SI Appendix, Fig. S1, for a detailed depiction of all country panels including axes titling and scaling.

