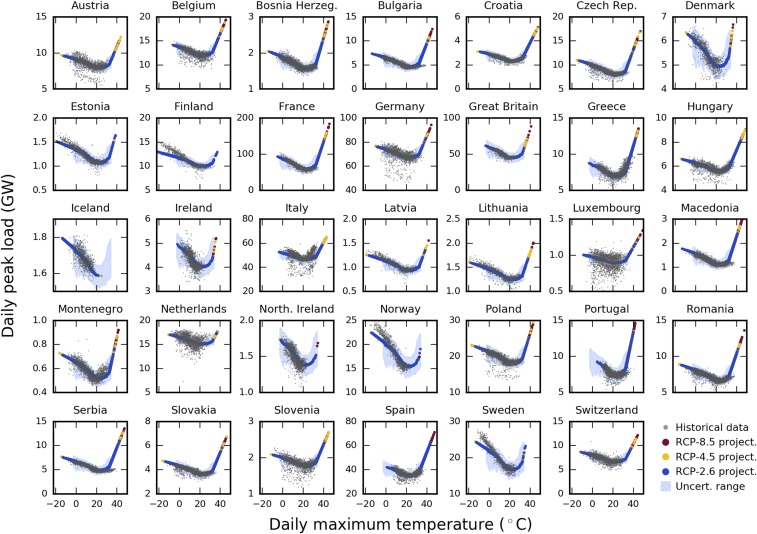
Fig. 3.
Estimated daily peak load values for projected daily maximum temperatures in 2013–2099 under three warming scenarios. Estimated peak load values for the years 2013–2099 under three different RCPs (blue, yellow, and red dots) lie well within the range of observational data ( gray dots). Blue shaded areas denote the uncertainty range (see Methods for details).

