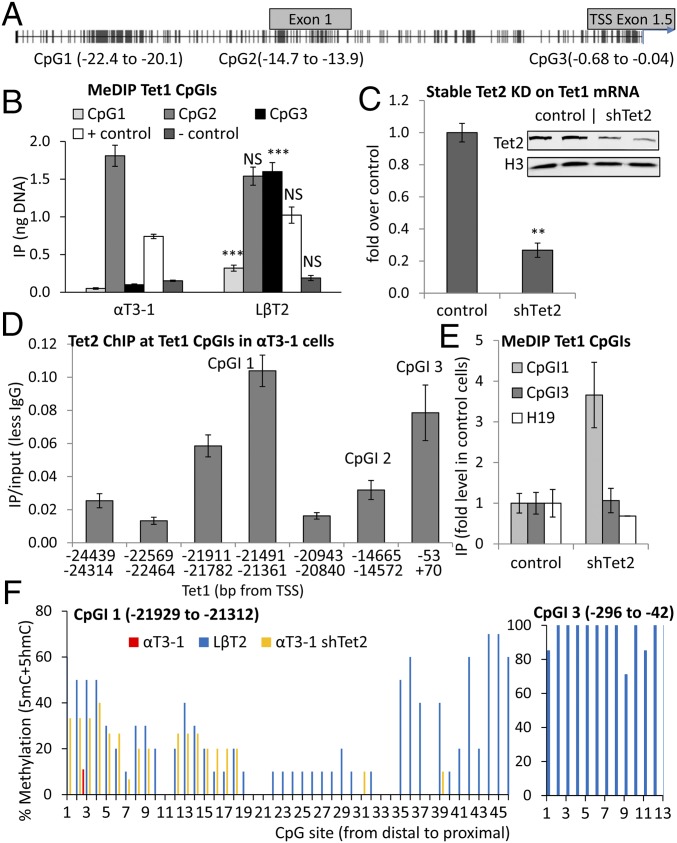
Fig. 3.
The region upstream of this Tet1 TSS can be methylated at three distinct CpGIs, but the distal part of the most 5′ CpGI is protected by TET2. (A) CpGIs upstream of Tet1 relative to the functional TSS. (B) Levels of 5mC DNA (relative to gDNA standard curve) at these CpGIs (n = 4–5). Statistical analysis (as in Fig. 1) compared each region between cell lines. (C) Tet1 mRNA levels after TET2 KD (shTet2) in αT3-1 cells; data analyzed and presented as before (n = 3–4). Western blot analysis shows the TET2 KD (n = 2). (D) ChIP of TET2 at the CpGs in αT3-1 cells, analyzed and presented as previously (n = 4–7). (E) MeDIP for the core of CpGI 1 (−21,491 to −21,361 bp) and CpGI 3 (−2 to −191 bp) from WT αT3-1 or shTet2 cells shown as fold in control cells, with H19 as unaffected positive control (n = 4–5). (F) BS analysis of Tet1CpGIs 1 and 3 in the two cell lines and for CpGI 1 in shTet2 cells; percentage of each CpG was methylated in 6–15 independent clones from each cell line.

