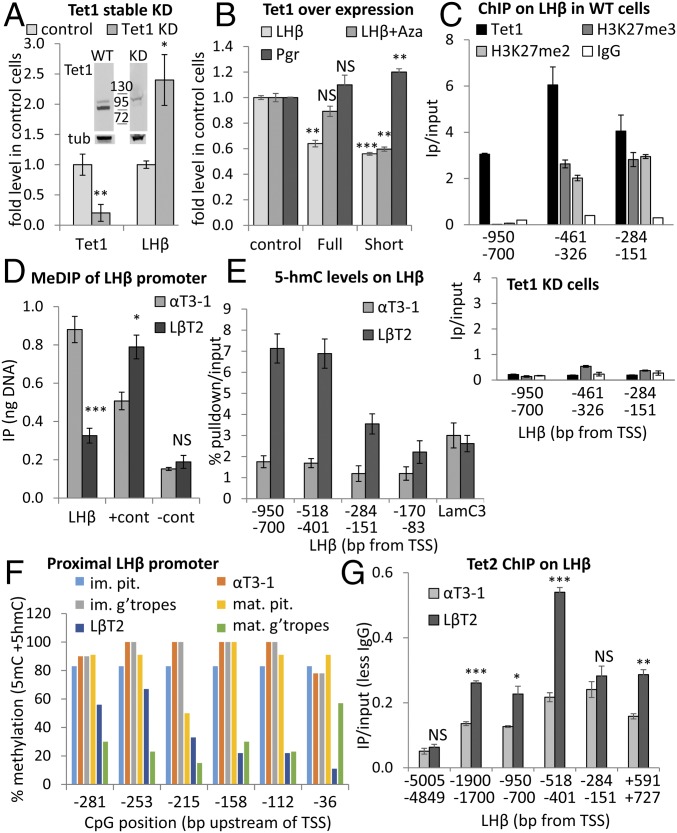
Fig. 5.
The truncated TET1 represses Lhb gene expression, regardless of DNA methylation, and does not catalyze 5hmC. (A) Tet1 and Lhb mRNA in αT3-1 cells after TET1 KD; data were analyzed and presented as before (n = 3–4). Western blot shows TET1 KD (lanes are from one blot, localized exactly as shown). (B) The canonical (full) or the truncated Tet1 isoform (short) were over-expressed in αT3-1 cells, some of which were treated with Aza for 48 h, and levels of Lhb or Pgr mRNA were measured, and are shown relative to control cells and analyzed as before (n = 2–3). (C) ChIP for TET1, H3K27me2, and me3 at the Lhb promoter in WT αT3-1 cells (Top) or for TET1 and H3K27me3 in TET1 KD cells (Bottom) as in Fig. 2. (D) MeDIP analysis at the Lhb gene promoter, calculated and presented as in Fig. 3B (n = 6). (E) 5hmC DNA at the Lhb promoter, with Lamc3 as positive control, shown relative to input (n = 4–6). (F) BS analysis of the Lhb promoter in gonadotropes from immature and mature mice, nongonadotrope pituitary cells (pit), and the gonadotrope cell lines. Data presented as in Fig. 3F; n = 6–20 clones from individual or pooled mice pituitaries and n = 9–10 clones for each cell line. (G) ChIP for TET2 upstream of Lhb, presented as in Fig. 3C (n = 3). Statistical analysis compared levels at each region between the cell lines.

