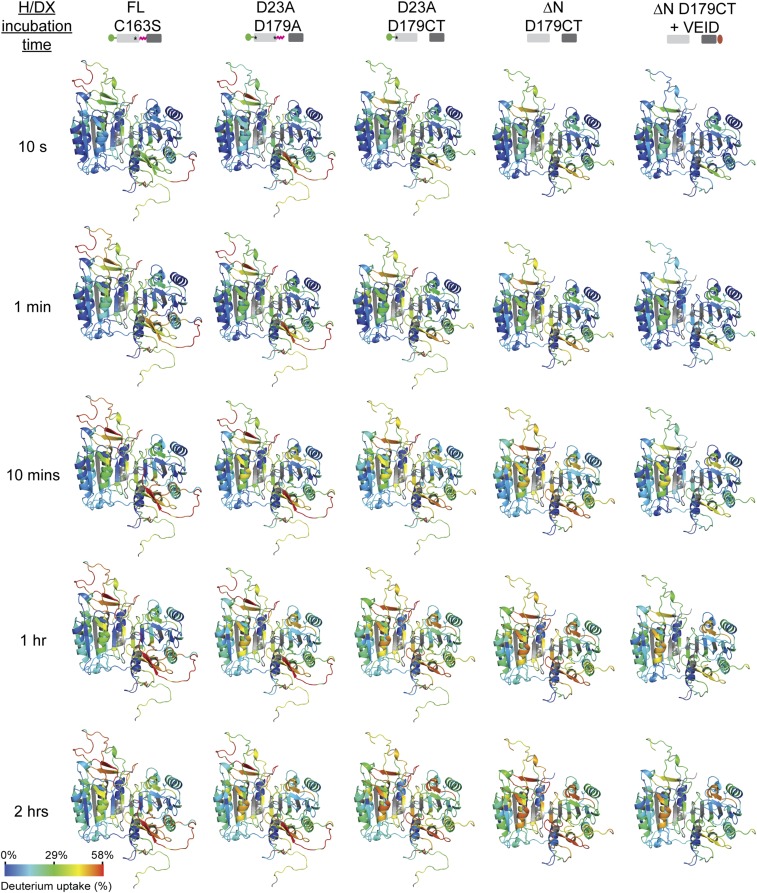
Fig. S1.
The percentage relative deuterium incorporations of caspase-6 mutation variants over the course of the H/D exchange incubation period are mapped onto the model structure of caspase-6. The percentage relative deuterium incorporation is calculated by dividing the observed deuterium uptake by the theoretical maximum deuterium uptake for each peptide. The intensities of the red and blue colors indicate increase and decrease in H/D exchange, respectively. The regions of the protein for which H/D exchange data are not available are shown in gray. The asterisk designates the D to A substitution at the indicated proteolytic cleavage site, rendering that site uncleavable.

