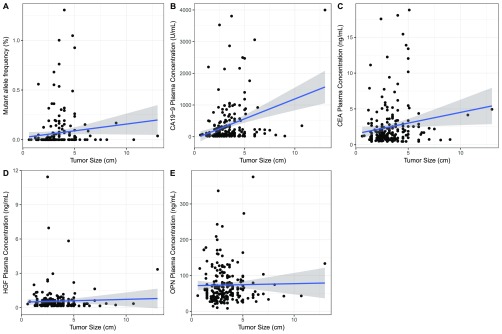
Fig. S2.
Correlation between triplex assay markers and tumor size. (A) KRAS mutations were found more frequently in larger tumors than smaller tumors, but the MAF did not correlate with tumor size (Pearson’s r = 0.039). (B) In patients with elevated CA19-9, the CA19-9 plasma concentration weakly correlates with tumor size (Pearson’s r = 0.287). (C–E) Plasma levels of CEA (C), HGF (D), and OPN (E) were less dependent on tumor size than KRAS mutations or CA19-9 (CEA: Pearson’s r = 0.153; HGF: Pearson’s r = 0.037; OPN: Pearson’s r = 0.018). Shaded regions represent 95% CIs.

