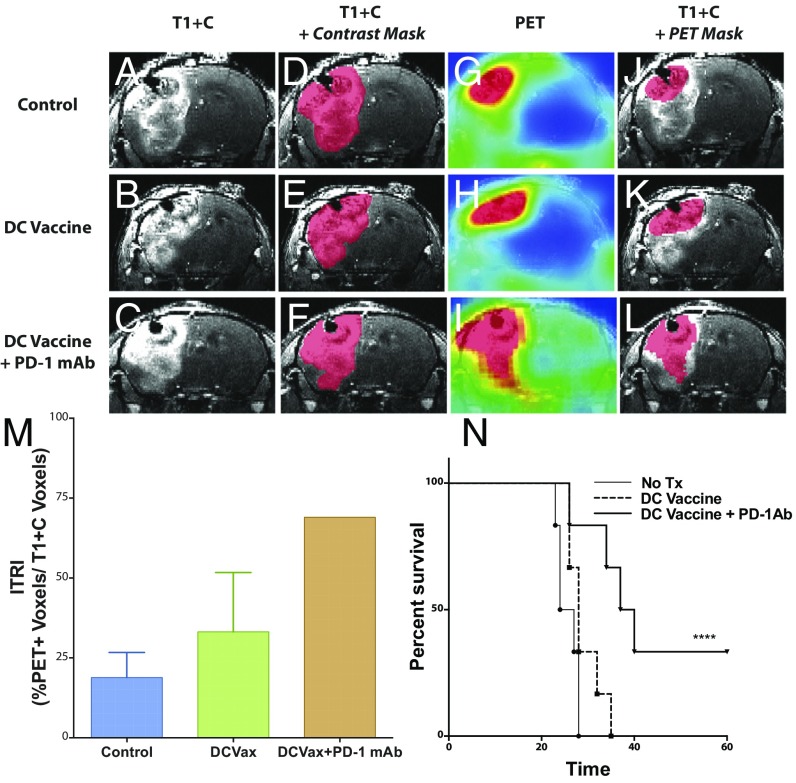
Fig. 4.
The ITRI predicts survival outcome in glioma-bearing mice following immunotherapy. (A–C) Representative coronal T1-weighted MRI sections of untreated control, DCVax-treated, and DCVax + PD-1 mAb-treated mice. (D–F) Representative contrast subtraction maps (red; contrast mask) overlaid onto T1-weighted MRI images with contrast. (G–I) Representative coronal [18F]-FAC PET images of untreated control and DCVax- and DCVax + PD-1 mAb-treated mice. (J–L) Representative threshold PET subtraction maps (red; PET mask) overlaid onto T1-weighted MRI images with contrast. (M) The ITRI (% PET voxels/T1+C voxels) calculated for each treatment group. n = 1–4 mice/group. Calculations were performed twice, with similar findings. (N) Survival of intracranial GBM-bearing untreated control (no Tx), DCVax-treated, and DCVax + PD-1 mAb-treated mice (****P < 0.0001); n = 6/group.

