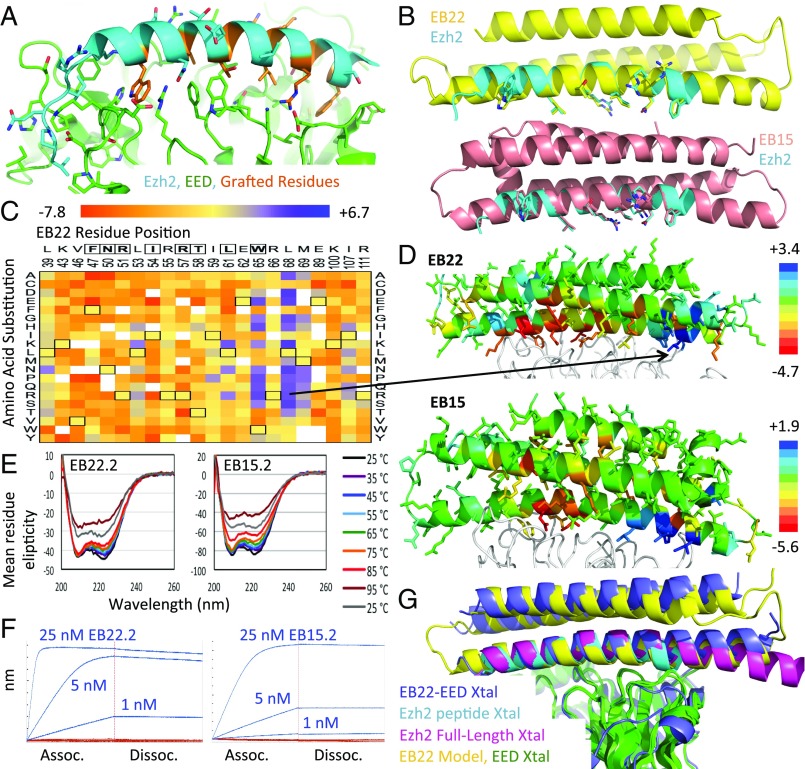
Fig. 1.
Design of EED binding proteins. (A) Crystal structure of Ezh2 N terminus (cyan) bound to EED (green) (PDB ID code 2qxv) with grafted residues highlighted in orange. (B) Models of EB22 (yellow, Top) and EB15 (salmon, Bottom) superimposed onto the Ezh2 peptide (cyan) with grafted residues shown as sticks. (C) Heat map of Log2 enrichments of EB22 interface position substitutions after one round of sorting. Grafted residues are boxed at the top of the heat map, while wild-type residues are boxed within the heat map. (D) Models of EED (white ribbon) bound to EB22 (Top) and EB15 (Bottom), each colored according to the median Log2 enrichment at each position after one round of sorting. The most enriched EB22 point mutation is indicated in the model by a black arrow. (E) CD thermal melts of EB22.2 (Left) or EB15.2 (Right). (F, Left) BLI traces of 1, 5, or 25 nM EB22.2 (blue) or EB22.2NC (red) bound to EED. (F, Right) As in Left, but for EB15.2 and EB15.2NC. (G) EB22–EED crystal structure (blue) or design model (yellow) superimposed (by aligning the EED molecules) onto crystal structures of Ezh2 peptide-EED (cyan) and full-length Ezh2–EED (magenta).

