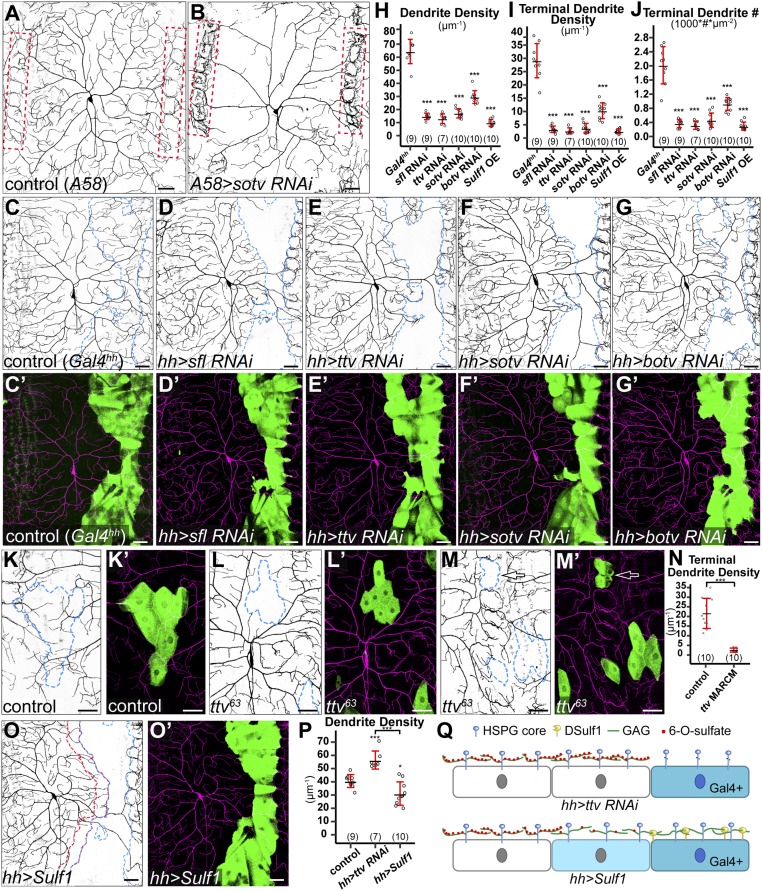
Fig. 1.
Epidermis-derived HSPGs are required for local growth of C4da dendrites. (A and B) DdaC neurons in the Gal4A58 control (A) and an animal expressing Gal4A58-driven sotv RNAi (B). Red dots outline the MASs. (C–G′) DdaC neurons in the Gal4hh control (C and C′) and animals expressing sfl RNAi (D and D′), ttv RNAi (E and E′), sotv RNAi (F and F′), and botv RNAi (G and G′) in the hh domain. Blue dots outline hh domains (Upper). Lower panels show hh domains (green) and C4da dendrites (magenta). (H–J) Quantification of total dendrite density (H), terminal dendrite density (I), and terminal dendrite number (J) in hh domains. ***P ≤ 0.001; ANOVA and Tukey’s HSD test. (K–M′) Epidermal MARCM clones of wild type (K and K′) and ttv63 (L–M′). Arrows point to a ttv63 epidermal clone at the MAS (M and M′). Merged panels show epidermal clones in green and C4da dendrites in magenta. (N) Quantification of terminal dendrite density in epidermal MARCM clones. ***P ≤ 0.001; Student’s t test. (O and O′) A ddaC neuron in an animal expressing membrane-tethered DSulf1 in the hh domain. Blue dots outline the hh domain, and red dots outline a one cell diameter-wide area anterior to the hh domain (O). Gal4hh-expressing cells are in green, and C4da dendrites are in magenta (O′). (P) Quantification of total dendrite density in the one cell diameter-wide area anterior to the hh domain. *P ≤ 0.05; ***P ≤ 0.001; ANOVA and Tukey’s HSD test. (Q) A diagram showing the effects of expressing ttv RNAi and membrane-tethered DSulf1 on epidermal HSPGs. Knockdown of ttv leads to the loss of HSPG GAG chains only on RNAi-expressing cells (dark blue), while membrane-tethered DSulf1 removes 6-O-sulfates of HSPG GAG chains on both DSulf1-expressing cells and cells directly contacting them (light blue). For all quantifications, each circle represents a neuron. The numbers of neurons are indicated. Black bar, mean; red bars, SD. (Scale bars, 50 µm.)

