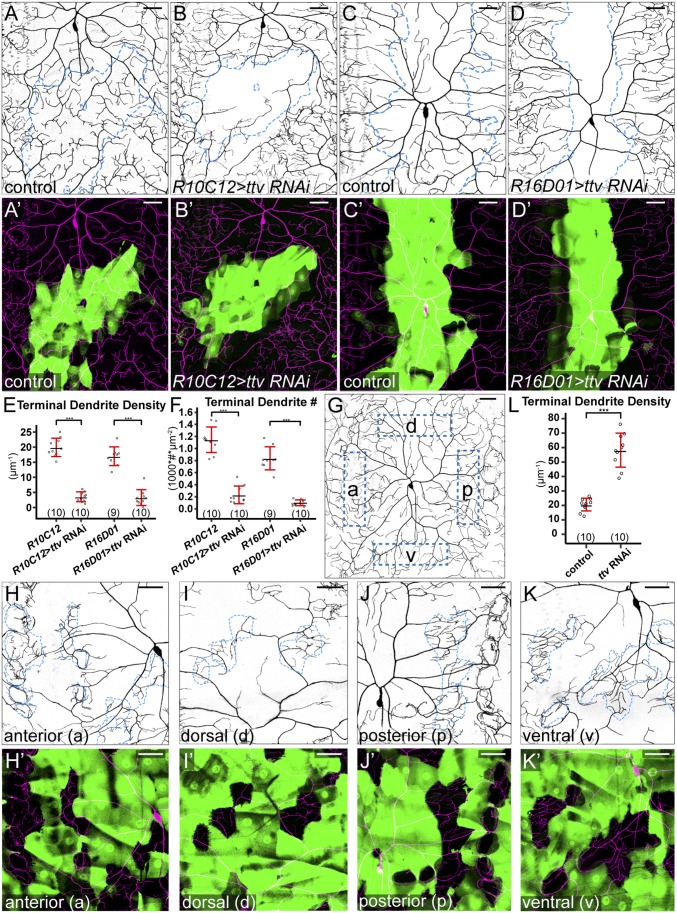
Fig. 5.
HSPGs do not promote dendritic growth by transporting diffusible signals. (A–B′) DdaC in an R10C12-Gal4 control (A and A′) and an animal expressing R10C12-Gal4–driven ttv RNAi (B and B′). (C–D′) DdaC in an R16D01-Gal4 control animal (C and C′) and an animal expressing R16D01-Gal4–driven ttv RNAi (D and D′). Blue dots in A–D outline Gal4-expressing cells, and A′–D′ show Gal4-expressing cells in green and C4da dendrites in magenta. (E and F) Quantification of terminal dendrite density (E) and terminal dendrite number (F). ***P ≤ 0.001; Student’s t test. (G) DdaC in a control animal with anterior (a), dorsal (d), posterior (p), and ventral (v) locations in the dendritic field indicated. (H–K′) DdaC dendrites in animals expressing ttv RNAi in random epidermal patches, showing wild-type epidermal cells surrounded by RNAi-expressing epidermal clones in anterior (H and H′), dorsal (I and I′), posterior (J and J′), and ventral (K and K′) regions of the dendritic field. Blue dots in H–K outline wild-type epidermal cells. H′–K′ show RNAi-expressing cells in green and C4da dendrites in magenta. (L) Quantification of terminal dendrite density in wild-type epidermal cells surrounded by control and ttv-RNAi–expressing epidermal clones. ***P ≤ 0.001; Student’s t test. For all quantifications, each circle represents a neuron. The numbers of neurons are indicated. Black bar, mean; red bars, SD. (Scale bars, 50 µm.)

