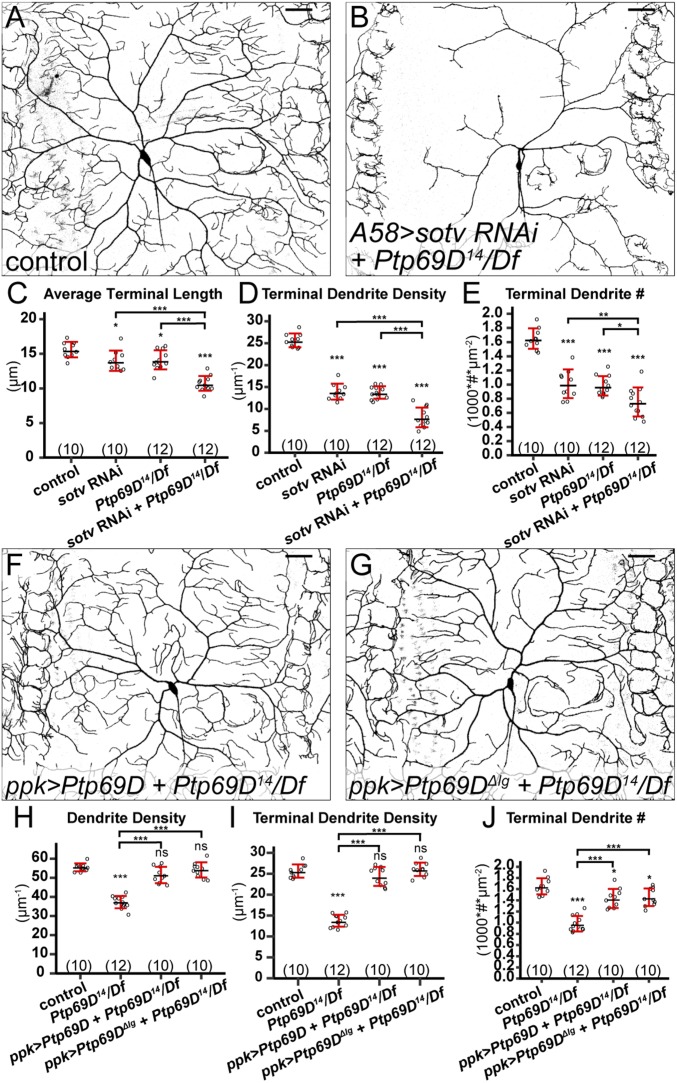
Fig. 7.
HSPGs and Ptp69D act in different genetic pathways. (A and B) DdaC in a Gal4A58 control (A) and a Ptp69D14/Df(3L)8ex34 animal expressing Gal4A58 > sotv RNAi (B). (C–E) Quantification of average terminal length (C), terminal dendrite density (D), and terminal dendrite number (E) in genotypes indicated. (F and G) DdaC in animals expressing ppk > Ptp69D (F) and ppk > Ptp69D-ΔIg (G) in the Ptp69D14/Df(3L)8ex34 background. (H–J) Quantification of total dendrite density (H), terminal dendrite density (I), and terminal dendrite number (J) in genotypes indicated. For all quantifications: ns, not significant; *P ≤ 0.05; **P ≤ 0.01; ***P ≤ 0.001; ANOVA and Tukey’s HSD test. Each circle represents a neuron. The numbers of neurons are indicated. Black bar, mean; red bars, SD. (Scale bars, 50 µm.)

