Fig. S4.
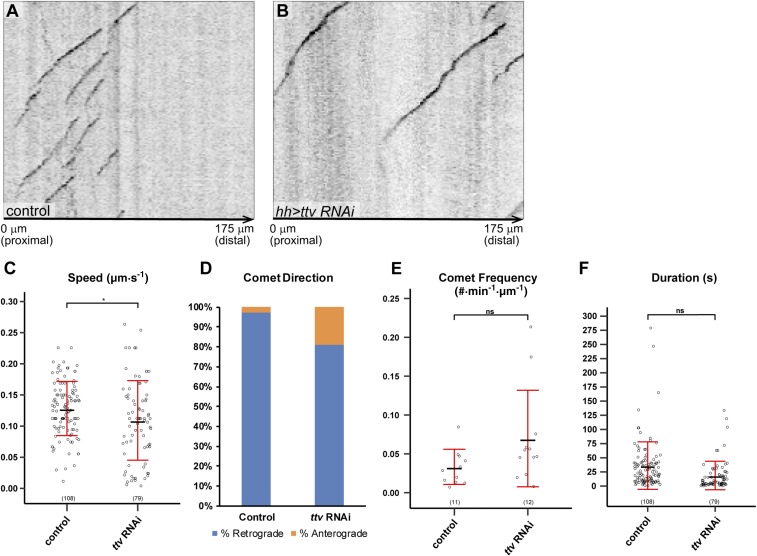
Dynamics of EB1-GFP in ttv knockdown. (A and B) Example kymographs of EB1-GFP comets in primary branches in the hh domain in a wild-type (A) and a Gal4hh > ttv RNAi (B) animal. The left edge of each kymograph marks the left border of the hh domain. The proximal-distal orientation of the dendrite and the distance from the border of the hh domain are labeled at the bottom of each panel. (C–F) Quantification of EB1-GFP comet speed (μm/s) (C), comet direction (D), comet frequency (#⋅min−1·µm−1) (E), and comet duration (s) (F) in wild-type and Gal4hh > ttv RNAi animals. For comet direction, the percentage of retrograde comets is shown in blue, and the percentage of anterograde comets is shown in orange. *P ≤ 0.05; ns, not significant; Student’s t test. For all quantifications, each circle represents a single EB1-GFP comet. The number of comets for each genotype is indicated. The black bars represent the mean, and the red bars represent the SD.

