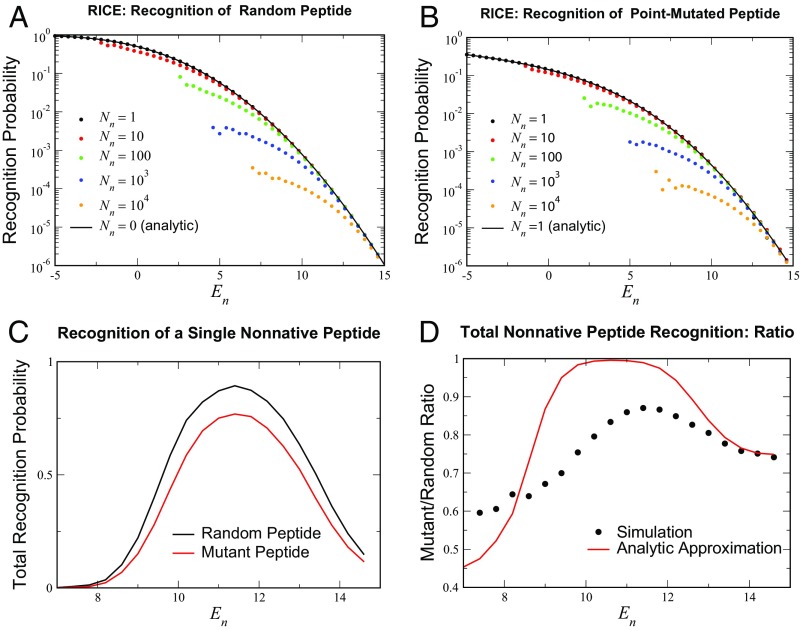
Fig. 4.
RICE recognition behavior. (A and B) Probabilities for a single selected TCR to recognize (A) random peptides and (B) point mutants of self-peptides for the analytically tractable limits and for higher values of . In both cases, the effect of increasing the number of negatively selecting self-peptides to has a relatively small effect on recognition rates in the range of relevant values (–) of . The simulation averaged over all of the surviving TCRs from the initial cohort of , a lower estimate of the mouse T cell diversity for a single MHC (36); random and point-mutant variants were tested. (C) The total recognition probability for the surviving () TCR cohort to recognize: a random peptide (black curve) and a single-site mutant of a native peptide (red). (D) The ratio of the two recognition probabilities in C; peptides of each class were tested. Included in D is the theoretical estimate of the ratio , where is the number of TCRs that survived selection.

