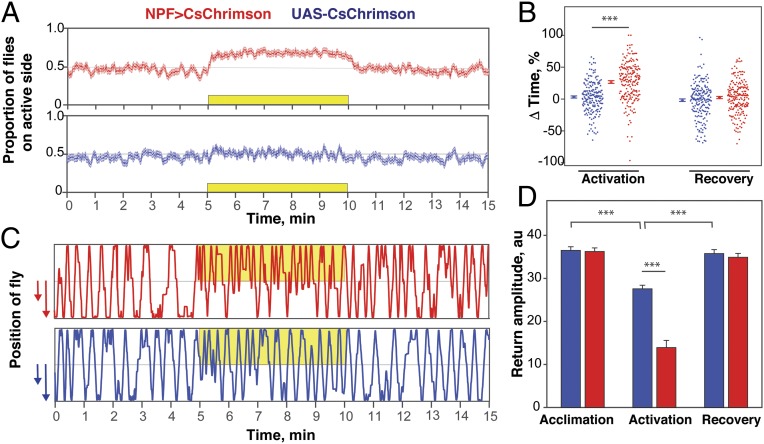
Fig. 2.
Flies display preference for NPF neuron activation independently of social (group) context. (A) Traces over time for the proportion of flies on the active side for single experimental NPF>CsChrimson flies (n = 203; Top) or single control UAS-CsChrimson flies (n = 198; Bottom). The yellow box indicates the period of activation. Data are expressed as mean ± SE (frequency of activation, 40 Hz; 617-nm LED light intensity, 5 µW/mm2). (B) ΔTime (%) (preference) of flies during the activation and recovery phases, showing that single flies have a significant preference for the activation of NPF neurons (unpaired t test; ***P < 0.001). (C) Representative traces of experimental (Top) and control (Bottom) flies. Yellow indicates time and side of illumination. (D) Return amplitude data showing that, during the period of activation, experimental flies move for shorter distances into the unilluminated side compared with control flies (unpaired t test; ***P < 0.001).

