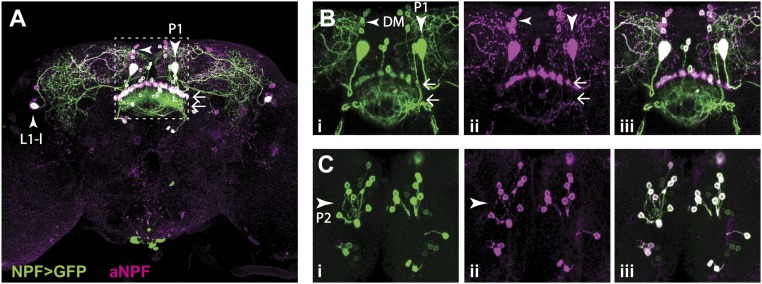
Fig. 7.
Expression of NPF and NPF-GAL4. (A) The NPF-GAL4 expression pattern includes two large neurons (P1 and L1-l) per hemisphere. (B) Higher-magnification view of the area indicated by the dashed box in A, showing that NPF is also expressed in several small neurons, located in the dorsal medial brain (DM) (left-facing arrowhead). Images correspond to the second third of the confocal stack. (C) Same area as shown in B, but images correspond to the first third of the confocal stack, which allows for the visualization of the cell bodies of the small neurons projecting to the FSB (horizontal arrows). Images correspond to the maximum intensity projection of different portions of a confocal stack collected from the posterior to the anterior end of the brain. Green: NPF-GAL4 expression pattern (i). Magenta: endogenous NPF expression (ii). White in iii: overlapping of NPF-GAL4 expression and NPF endogenous expression. (Magnification: 20×.)

