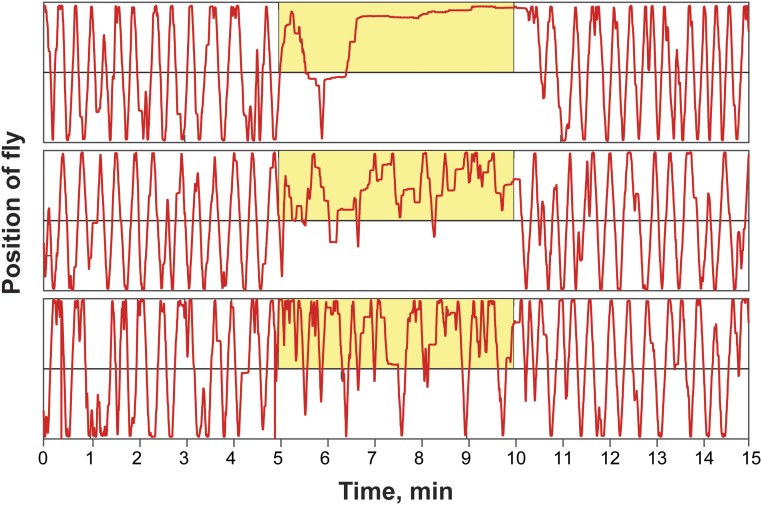
Fig. S3.
Representative traces of single NPF>CsChrimson flies. Representative position over time traces for NPF>CsChrimson flies showing different levels of locomotion during the activation period. Locomotor activity during the acclimation and recovery phases are comparable. The yellow box indicates the side and period of activation (617-nm LED light intensity, 5 µW/mm2; frequency of activation, 40 Hz).

