Fig. S4.
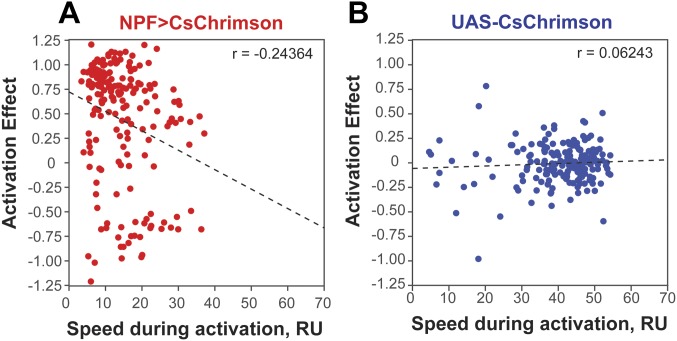
Scatterplot of the preference (activation effect) vs. speed during activation for grouped NPF>CsChrimson flies (n = 186) (A) or grouped control flies (n = 179) (B), showing that preference and speed during activation are negatively correlated in NPF>CsChrimson flies (r = −0.2517; P < 0.001), but not in control flies (r = 0.0637; P > 0.05).

