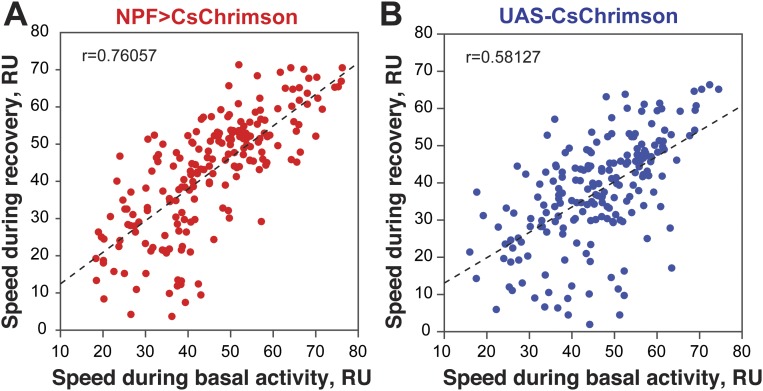
Fig. S5.
Scatterplot of the speed during the recovery phase vs. speed during acclimation phase for single NPF>CsChrimson flies (n = 203) (A) or single control flies (n = 198) (B), showing that speed during recovery and acclimation are positively correlated in both NPF>CsChrimson flies (r = 0.7606; P < 0.001) and control flies (r = 0.5813; P < 0.001).

