Fig. 5.
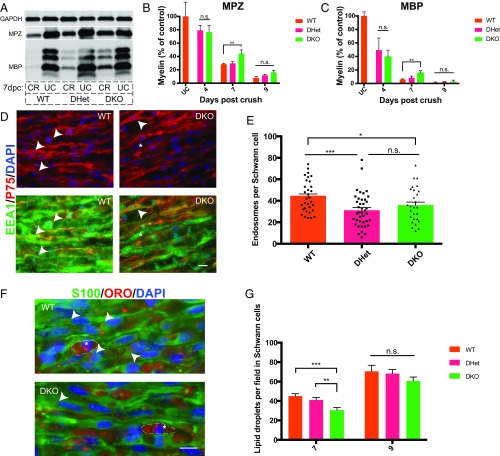
Schwann cells use Axl and Mertk to clear myelin debris in vivo. (A) Representative Western blot showing myelin protein (MBP and MPZ) levels in wild-type, Axl/Mertk double-heterozygous, and Axl/Mertk double-knockout mouse sciatic nerves at 0 and 7 dpc. Protein lysates were generated from single nerves, and each Western blot well was loaded with the same amount of total nerve protein. CR, crushed; UC, uncrushed. (B and C) Quantification of MPZ- and MBP-stained Western blots of protein lysates from WT, Axl/Mertk double-heterozygous, and Axl/Mertk double-knockout mouse sciatic nerves at 0, 4, 7, and 9 dpc. n = 3 to 10 per genotype per time point. Data are presented as mean ± SEM. (D) Representative IHC images of cryosections of 9-dpc WT and Axl/Mertk DKO mouse sciatic nerves stained with antibodies to EEA1 (endosomes) and p75 (Schwann cells). Arrowheads indicate colocalization of EEA1 and p75, while asterisks indicate EEA1 immunoreactivity in a p75-negative cell, presumably a macrophage. (Scale bar, 10 μm.) (E) Quantification of IHC images of EEA1- and p75-labeled Schwann cells. Graph of average endosome abundance (EEA1 puncta) per Schwann cell at 9 dpc in Schwann cells from WT, Axl/Mertk double-heterozygous, and Axl/Mertk double-knockout mice. Eight cells were blindly selected and analyzed per animal. n = 4 or 5 animals per genotype. Data are presented as mean ± SEM. (F) Representative IHC images of 7-dpc cryosections of WT and Axl/Mertk DKO mouse sciatic nerves stained with ORO (lipid droplets) and antibodies to S100 (Schwann cells). Arrowheads indicate ORO within an S100-positive cell, while asterisks indicate ORO-positive droplets in S100-negative cells, presumably macrophages. (Scale bar, 10 μm.) (G) Quantification of ORO-positive lipid droplet abundance per field at 7 and 9 dpc in blindly selected and analyzed fields of IHC-stained tissue from WT, Axl/Mertk double-heterozygous, and Axl/Mertk double-knockout mice. n = 4 to 10 animals per genotype per time point. Four images were analyzed per animal. Data are presented as mean ± SEM. *P < 0.05, **P < 0.01, ***P < 0.001.

