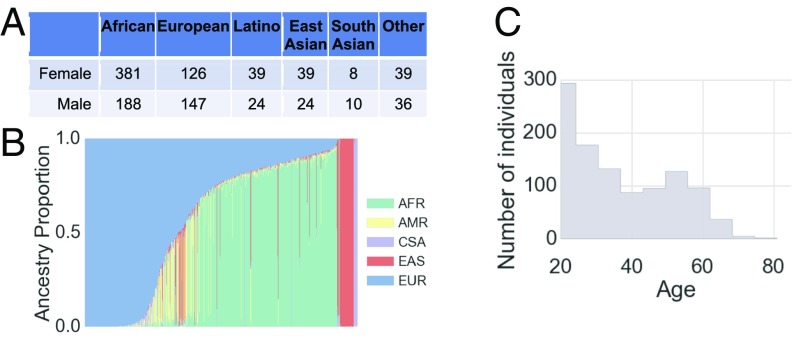
Fig. 1.
Study overview. (A) Distribution of self-reported ethnicity in the study. (B) Inferred genomic ancestry proportions for each study participant. Ancestry components are African (AFR), Native American (AMR), Central South Asian (CSA), East Asian (EAS), and European (EUR). (C) Distribution of ages in the study.

