Significance
The processes that mediate crystal nucleation and growth, and the transformation between crystal structures having different lattice symmetries, are of fundamental importance to a wide range of scientific disciplines. Here, we use single crystals of liquid-crystal blue phases with a controlled orientation to study the liquid analog of a crystal–crystal transformation. In contrast to traditional atomic crystals, the transitions that arise in blue phases take place over submicron length scales. They do, however, occur in a diffusionless manner, with characteristics that are reminiscent of traditional martensitic transformations in atomic crystals.
Keywords: blue phase, chiral liquid crystals, self-assembly, chemical patterns, martensitic transformation
Abstract
Liquid-crystal blue phases (BPs) are highly ordered at two levels. Molecules exhibit orientational order at nanometer length scales, while chirality leads to ordered arrays of double-twisted cylinders over micrometer scales. Past studies of polycrystalline BPs were challenged by the existence of grain boundaries between randomly oriented crystalline nanodomains. Here, the nucleation of BPs is controlled with precision by relying on chemically nanopatterned surfaces, leading to macroscopic single-crystal BP specimens where the dynamics of mesocrystal formation can be directly observed. Theory and experiments show that transitions between two BPs having a different network structure proceed through local reorganization of the crystalline array, without diffusion of the double-twisted cylinders. In solid crystals, martensitic transformations between crystal structures involve the concerted motion of a few atoms, without diffusion. The transformation between BPs, where crystal features arise in the submicron regime, is found to be martensitic in nature when one considers the collective behavior of the double-twist cylinders. Single-crystal BPs are shown to offer fertile grounds for the study of directed crystal nucleation and the controlled growth of soft matter.
There is considerable interest in understanding at a fundamental level the processes through which crystals are nucleated, and how they grow and transform between different lattice symmetries. Among crystal–crystal transformations, martensitic transitions are of particular interest, as they involve a collective and diffusionless atomic rearrangement that occurs at velocities comparable to the speed of sound in the material (1). Here, we use liquid crystals (LCs) that exhibit long-range order and crystalline symmetries with lattice constants in the submicron regime, the so-called blue phases (BPs), to study a liquid analog of a crystal–crystal transformation. BPs are thermodynamically stable liquid crystalline states that occur in a narrow range of temperatures between the cholesteric (Chol) and isotropic (I) phases of chiral LCs. In BPs, the molecules are locally oriented and organized in such a way as to form structures known as double-twist cylinders. These cylinders, which arise from a balance of long-range elastic distortions and short-range enthalpic contributions to the free energy, adopt a cubic lattice structure, which is interdispersed by an ordered network of topological defects (disclination lines). Depending on the thermodynamic conditions, the double-twist cylinders adopt a body-centered cubic structure (BCC), which produces the so-called blue phase I (or BPI), or they adopt a simple cubic structure (SC), which corresponds to the so-called blue phase II (or BPII). In both cases, the lattice parameters are on the order of a few hundred nanometers (2–4). BPs exhibit selective light reflections; they have fast electro-optical switching characteristics, with submillisecond response times, and their viscosity is relatively large (3, 5–8). This combination of properties offers advantages over conventional LCs for emerging applications in the realm of electro-optical and sensing technologies (5–15). A number of important limitations, however, have severely limited their widespread use. These include the narrow range of temperature over which they are stable, and the polycrystalline nature of the actual specimens that are typically produced in traditional experiments on homogeneous surfaces. Polycrystalline structures are generally riddled with grain boundaries that can severely limit electro-optical performance. Recent efforts have sought to develop strategies to significantly increase the thermal stability of BPs (14, 16–23). Control of the lattice orientations of BPs, however, has been difficult to achieve; unlike nematic LCs, the molecular alignment of BPs is not uniform, and multiple nucleation seeds occur simultaneously during the course of a BP phase transition (24–28).
Recently, Chen et al. carried out experiments of BPs confined between chemically homogenous surfaces; consistent with expectations, they observed that the nucleation process determines the monodomain size and the corresponding crystal orientation. These authors also observed that nucleation is mediated by the chemical interactions and anchoring energy between the LC molecules and the surface (29). Phase transitions between BPs have been found to be first order. They involve latent heat (30), and the BPI–BPII transformation is preceded by a crosshatched structure that is attributed to a mismatch between the different BP–lattice symmetries (4). However, in past experiments, the polycrystalline nature of the BP samples, with an abundance of multiplatelet domains (grain-like), precluded direct observation of the crystal nucleation and growth kinetics, and of the reorganization of the lattice structure during the BPI–BPII transition. In recent work, Henrich et al. adopted a theoretical perspective to study the dynamics of the ordering process of BPs. Specifically, these authors simulated BPI or BPII nuclei embedded in an isotropic or a cholesteric background (31), and found that BPs grow disorderly from the nuclei, leading to metastable states characterized by an amorphous defect network. In their work, the nuclei were quenched to temperatures where the BPI and BPII are thought to be stable; these authors then suggested that the ordering dynamics of BPs exhibits a hierarchical nature, which requires a secondary nucleation stage to control the nucleation and orientation of bulk BPs.
Motivated by the challenges outlined above, and building on demonstrations from our group where chemically patterned surfaces were used to direct the self-assembly of sphere-forming block copolymer into ordered structures by controlling the boundary conditions and film thickness (32), we recently proposed a different strategy to direct the formation of stable monodomain, single-crystal BP specimens over macroscopic (millimeter) length scales (33). A central feature of that strategy is the ability to control the lattice orientations of the BPs during the course of a phase transition, be it from isotropic to BP (I to BP), or from cholesteric to BP (Chol to BP). By relying on ideas from small and large-molecule epitaxial growth, where a patterned substrate is used to seed the nucleation of crystalline domains, we designed chemically patterned surfaces to directly assemble double-twist cylinder structures into homogeneous, single-crystal BPs that adopt a prescribed lattice orientation (a desired optical axis). The specifically designed chemical patterns are used to impose planar or homeotropic (perpendicular) molecular alignments at the surface with nanoscale precision. The chemical pattern’s characteristics were inferred from theoretical calculations, using state-of-the-art simulations that enable description of large samples of chiral LCs (33). In this work, we capitalize on such pattern designs and our ability to pattern surface-grafted LC polymer brushes to produce macroscopic single-crystal BPI and BPII samples with cubic lattices where the (1 1 0) and the (1 0 0) planes are parallel to the substrate, respectively. Our experimental setup allows us to track the nucleation and epitaxial growth of the BPs along different kinetic pathways. By examining the transition between BPI and BPII, we are then able to generate a detailed picture of a macroscopic crystal–crystal phase transition that, to our knowledge, is without precedent in the literature.
Three distinct nucleation regions are identified: the patterned surface, the nonpatterned surface, and the bulk. These regions provide access to different levels of engineering control for the creation of single-crystal BPs. Our experimental observations are interpreted in terms of large-scale simulations, which provide detailed insights into the surface-guided BPII–BPI transition. Through that process, BP defects are shown to locally fold (or unfold), move, and reconfigure without getting trapped into disordered metastable states. If one adopts the view that defects are mesoscale objects, both experiments and simulations suggest that the chemical patterns direct the BPI–BPII transformation through a local, diffusionless reorganization process, characterized by collective motion of the cubic lattices over large sample areas. In the particular context of a crystal-to-crystal transition, we find that it is possible to have a martensitic-like transformation in liquids, where the diffusionless feature takes place on submicron scales, and is associated with the collective motion of double-twisted cylinders. The transition is remarkably fast—in a matter of seconds (or less), the material undergoes a transformation between two macroscopic BP single crystals. More generally, the epitaxial assembly strategy presented here offers an opportunity to directly examine nucleation and growth processes over much longer length scales than with atomic crystals.
Results
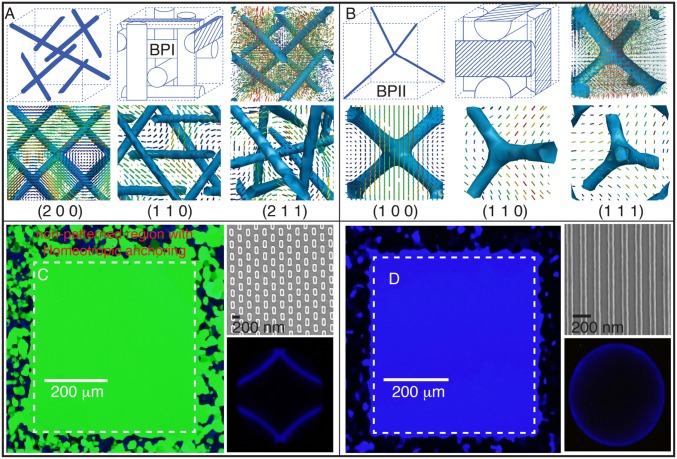
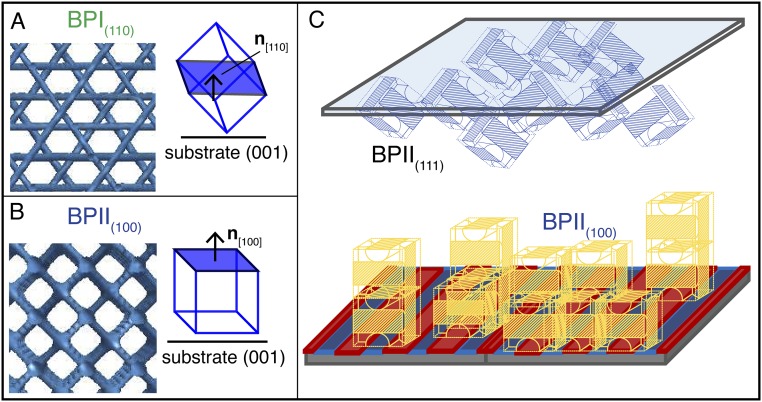
The BPs of the chiral LC used in this work have unit cell sizes aBPI = 255 nm and aBPII = 150 nm for the BPI and BPII, respectively (15). The LC is confined into 1.0 × 1.5-cm hybrid-anchored channels, with a thickness of 3.5 μm. The phase transition temperatures of the confined BPLC mixture were determined to be as follows: Chol → BPI, 39.5 ± 0.1 °C; BPI → BPII, 40.5 ± 0.1 °C; BPII → Iso, 42.5 ± 0.1 °C. For the chiral dopant concentrations used in this work, the BPIII phase is not observed; therefore, the transition occurs directly from the isotropic phase to BPII. The hybrid cell comprises a modified octadecyltrichlorosilane (OTS) glass surface at the top, which imposes homeotropic alignment, and a homeotropic bottom surface that includes a 440 × 440-μm chemically patterned area, with alternating regions of planar and homeotropic anchoring (Fig. S1). As mentioned earlier, BPs form periodic networks of disclination (defect) lines. Fig. 1 A and B show the disclination lines of the BPI and BPII unit cells, respectively. In the BPI, the defect lines are straight and do not intersect with each other. Since the BPI has a BCC symmetry, light reflection is only possible from the crystallographic planes (h k l), where the sum of the Miller indices, h + k + l, is an even number. According to Braggs’ law, for incident light normal to the (h k l) plane, the wavelength of the reflected light is given by , where n is the refraction index. For the BPII, the disclination lines form a four-arm junction at the center of the unit cell; the crystalline symmetry is SC, and light reflection is possible from all crystallographic planes. Fig. 1 includes the preferred local molecular orientation at different crystallographic planes. In this work, we denote by BPI(hkl) and BPII(hkl) the (h k l) BP lattice orientations that are parallel to the underlying substrate (Fig. S2).
Fig. S1.
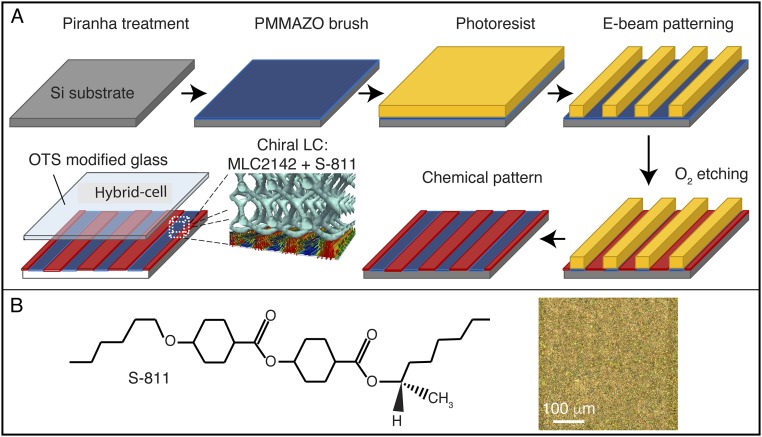
Fabrication process of chemical pattern surface. (A) Schematic representation of the fabrication process to produce chemically patterned surfaces. (B) S-811 chiral dopant for the LC MLC2142, including an image of the cholesteric phase at room temperature.
Fig. 1.
Single-crystalline BPI and BPII on chemically patterned surfaces: (A and B) Line defect lattice structures and molecular orientations in a unit cell for (A) BPI and (B) BPII. The low–scalar-order parameter isosurfaces (blue) along different lattice planes are shown for the BPI: (2 0 0), (1 1 0), and (2 1 1); and the BPII: (1 0 0), (1 1 0), and (1 1 1). The color maps for molecular orientation are represented according to the projection of that orientation on the surface: blue is for molecules parallel to the surface, while red is for molecules perpendicular to the surface. (C and D) Confined MLC2142 mixed with the S-811 chiral dopant between an OTS-modified glass and a chemically patterned substrate, in a BP state; (C) a rectangular pattern is used to form a stable single-crystalline BPI at 40.4 °C; and (D) a striped pattern is used to form a stable single-crystalline BPII at 42.2 °C. The corresponding Kossel diagrams are shown to indicate the lattice symmetry. An experimental control is made by patterning a 440 × 440-μm area, keeping a border with a homeotropic anchoring alignment. The entire hybrid-cell thickness is 3.5 μm.
Fig. S2.
A BP(hkl) refers to a BP oriented with the (h k l) plane parallel to the pattern surface: A shows a BPI(110) where the (1 1 0) plane is parallel to the patterned surface (0 0 1); B shows a BPII(100) where the (1 0 0) plane is parallel to the patterned surface (0 0 1). (C) The patterned surface seeds a uniform BPII(100), while the top OTS surface favors a BPII(111), which grows disordered over the x and y directions.
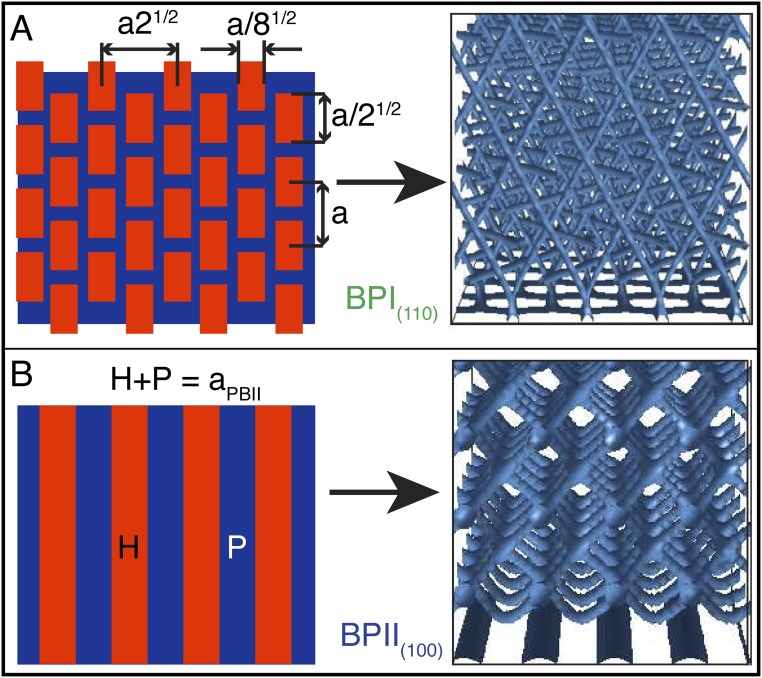
Following our previous work (14), a patterned surface consisting of an hexagonal array of rectangular areas (which impose planar anchoring to the LC over an otherwise homeotropic background) is used to produce a single-crystal BPI(110) phase. Since aBPI = 255 nm, then nm, the single crystal takes on a uniform green color. A stripe-like pattern, on the other hand, consisting of alternating regions of planar and homeotropic anchoring, directs the formation of a single-crystal BPII(100) phase. Considering that aBPII = 150 nm, only the (1 0 0) planes reflect a blue visible light with nm. The rectangular and striped patterns are shown in Fig. 1 C and D, which include reflected light microscope images of the single-crystal BPI and BPII phases and their corresponding Kossel diagrams, which are used to verify the lattice symmetry (Figs. S3 and S4 for the geometrical details of the chemical patterns and Kossel diagrams).
Fig. S3.
Chemical pattern surfaces stabilize different lattice orientation of BPs. The strategy to obtain pattern designs is based on an analysis of the scalar-order parameter in the immediate proximity of a uniform homeotropic surface. Patterns are obtained by identifying regions that favor either homeotropic or planar anchoring (see ref. 33 for details). (A) Rectangle-array pattern template for the BPI(110) and (B) stripe pattern for the BPII(100).
Fig. S4.
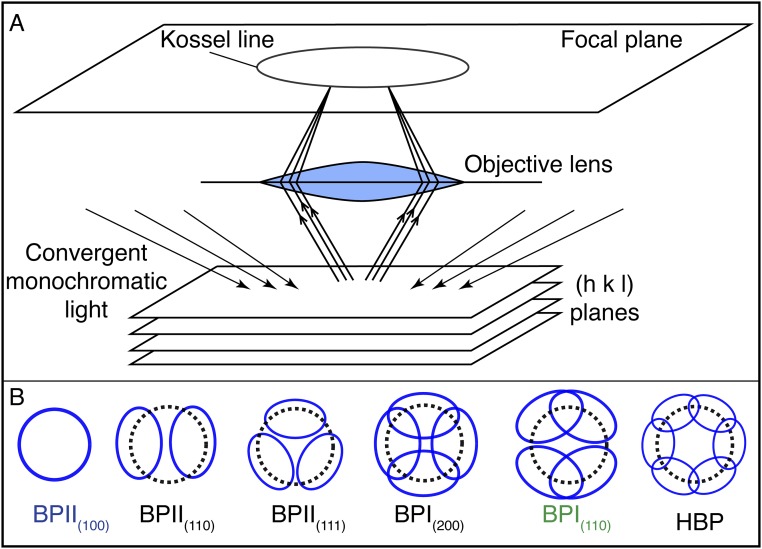
Schematic of Kossel diagram. (A) Schematic illustration for obtaining Kossel diagrams. Incident convergent monochromatic light is reflected by the set of (h k l) planes. The Kossel line that is obtained on the focal plane depends on the crystallographic orientation of the BP cell. (B) Kossel lines, or simply Kossel diagrams for BPI and BPII at different crystallographic orientations, as well as the HBP, which corresponds to the hexagonal BP. Additional details can be found in ref. 34.
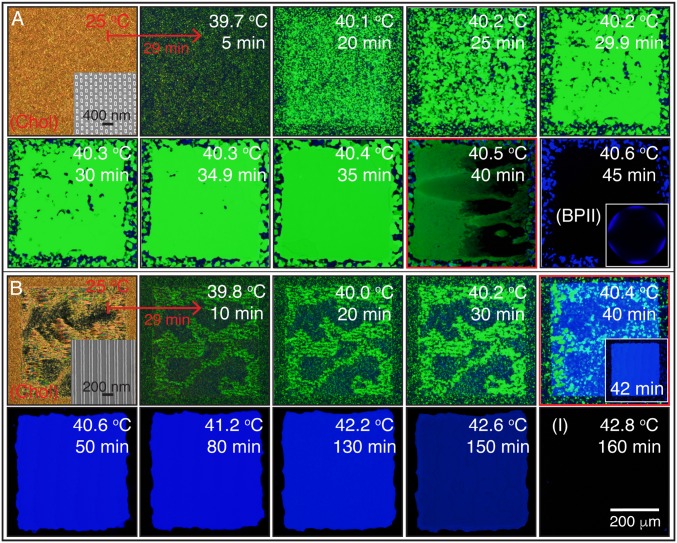
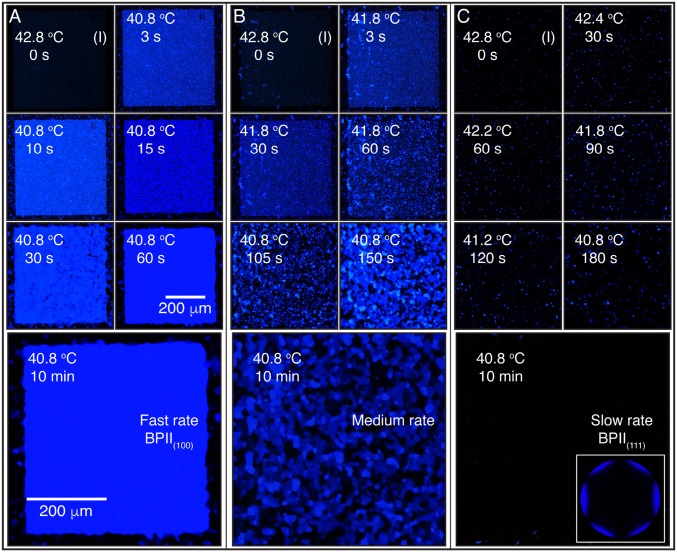
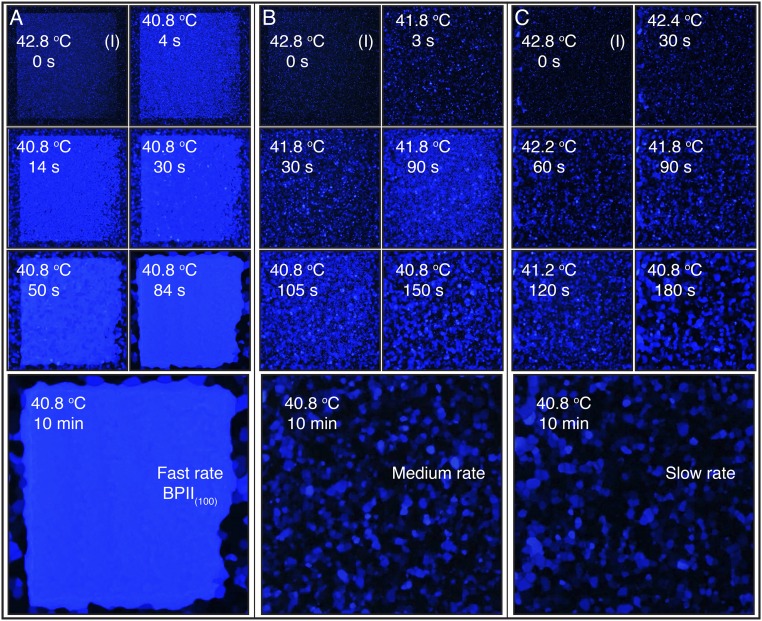
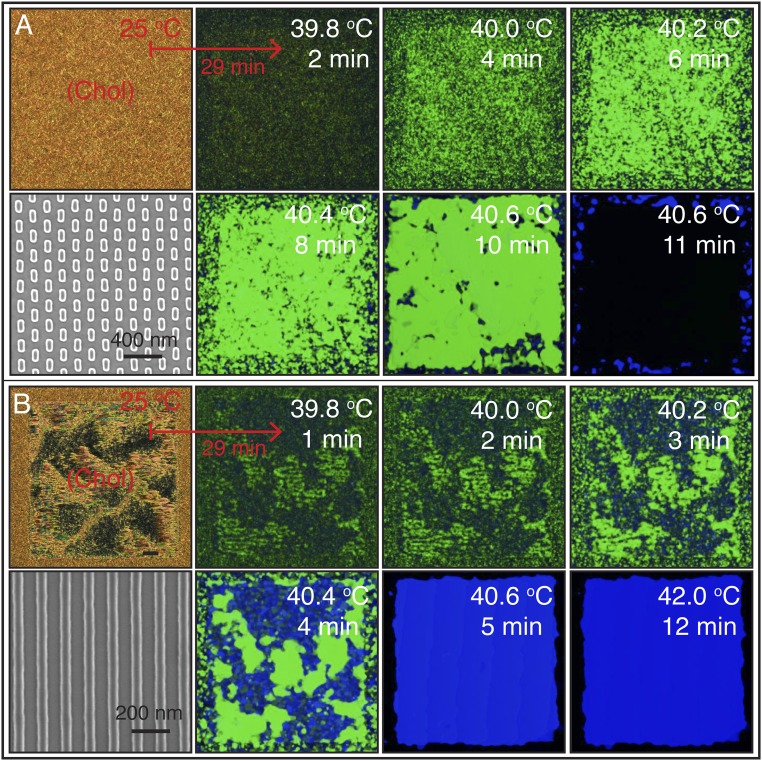
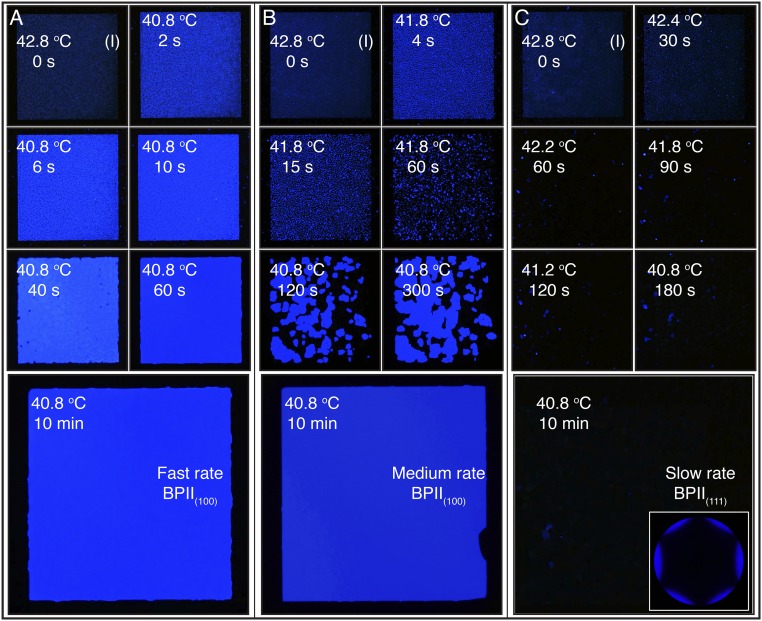
We start by heating the hybrid cell from a cholesteric phase and examine the sequence of transitions Chol → BPI → BPII for both the rectangular pattern and the striped pattern. Fig. 2A corresponds to the sequence of images when the rectangular pattern is used to direct the formation of a single-crystal BPI(110). During a BPI–BPII transition, the material undergoes a reconfiguration where the crystalline symmetry of the BP changes from BCC to SC. When the rectangular pattern is used, a heating process produces a transition from the BPI(110) (single crystal, dense green) to the BPII(111) (dark monodomain). On the other hand, the striped pattern provides a platform to generate macroscopic single-crystal BPII samples. Once the temperature reaches the BP region, after heating a cholesteric phase, multidomains of BPI start to form. At the BPI–BPII transition temperature, the dark blue BPI(200) domains become BPII(100) regions, which turn blue almost immediately; the green domains of BPI(110) are initially bright green, and gradually turn blue (Fig. 2B). Since both BPs reflect visible light, we focus on the striped pattern and assess the degree of hysteresis when the temperature is varied in the BP range. When the BPs are formed by cooling from the isotropic phase, the chemical pattern mediates the nucleation of the BP. The binary striped pattern of alternative planar and homeotropic anchoring with 150-nm period produces single-crystal BPII(100) specimens (33). The uniform homeotropic anchoring, imposed by the top surface, prefers to induce a BPII(111). In the nonpatterned regions of the bottom substrate, multiple nucleation events and distinct mechanisms (heterogeneous and homogeneous) are at play, resulting in randomly oriented BP domains. For a fast cooling process (Fig. 3A), the nucleated seeds on the patterned area dominate the crystal growth, and direct the formation of a single-crystal BPII(100). Conversely, a slow cooling scheme promotes a top-substrate–mediated nucleation, and leads to a BPII(111) (Fig. 3C). The symmetry of the Kossel diagram shown in Fig. 3C is consistent with the formation of a hexagonal blue-phase (BPH) layer in the proximity of the patterned surface (33) (Fig. S5). In contrast to observations from solid-state crystal growth processes, the LC molecules are able to move and realign in a BP, thereby enabling a fast “sintering” process of crystals having the same orientation. At intermediate cooling rates (Fig. 3B), both surfaces compete and the final BP consists of a mixture of black and blue domains (see Supporting Information for the details of BP crystal nucleation and growth by heating and cooling processes, and Figs. S6–S9).
Fig. 2.
BP crystal nucleation and growth from a cholesteric phase: heating. The hybrid cell is heated from below using a stepwise process that increases the temperature by 0.1 °C every 5 min from an initial value of 39.6 °C. The cholesteric to BP initial heating rate is 0.5 °C per min, starting from 25 °C. Cross-polarized mode reflected light microscope images of (A) rectangular pattern substrate, which directs the formation of a single-crystal BPI at temperatures between 39.7 and 40.4 °C; (B) striped pattern, which is used to obtain a single-crystal BPII between 40.4 and 42.2 °C. The dense green and blue colors over the 440 × 440-μm patterned area reveal the single-crystal nature of the BPs. The red squares highlight the temperatures where phase transformations are observed: 40.5 and 40.4 °C for the rectangular and striped patterns, respectively. In A, a Kossel diagram for the final BPII is included. The BPI-to-BPII transformation, using the striped pattern, occurs within a 2-min interval at 40.4 °C.
Fig. 3.
BPII crystal nucleation and growth from an isotropic phase: cooling. The hybrid cell is cooled from an isotropic phase at 42.8 °C using three cooling schemes: (A) a sudden temperature decrease to 40.8 °C; (B) an initial temperature decrease of 1 °C, followed by an additional one after 60 s; and (C) a slow stepwise cooling process of 0.4 °C every 30 s, and corresponding Kossel diagram for the final BPII state. The reported temperature values are for the Si substrate.
Fig. S5.
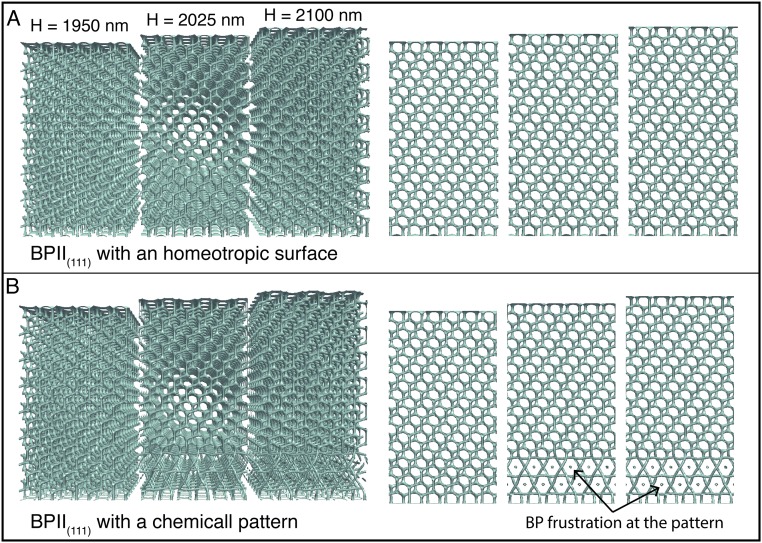
Orientation of BPII(111) on different surfaces. (A) The BPII(111) is the preferred orientation that a BPII adopts when it is confined by uniform homeotropic surfaces. (B) Previous results have shown, however, that confinement, combined with assembly on a patterned surface, induces a hexagonal blue phase (HBP) in the proximity of the treated surface. The BP is frustrated by the patterned surface, and it has to change its defect configuration near the surface to accommodate the confinement.
Fig. S6.
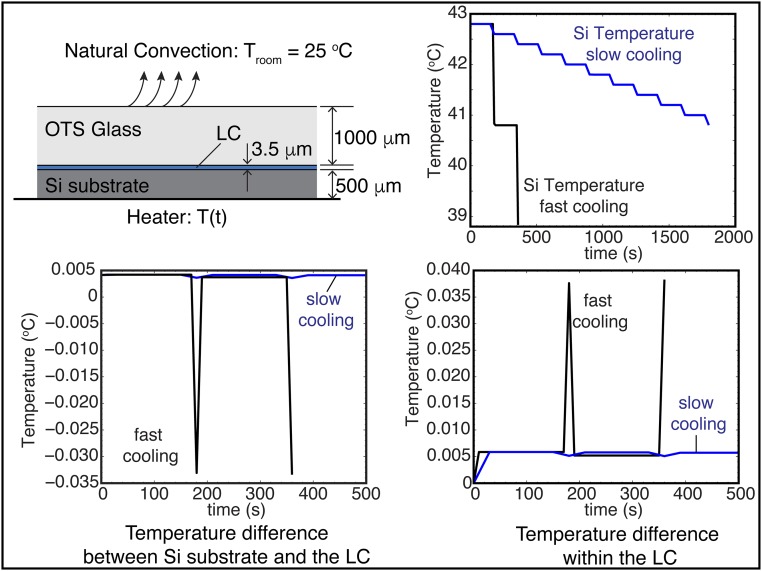
Heat transfer analysis. Schematic representation of the heating/cooling experimental setup (not to scale), including the boundary conditions for the heat transfer analysis. Transient finite-element simulations are used to generate a detailed picture of the heat transfer within the hybrid cell. The cell is heated/cooled from below with a known temperature; the cell also undergoes a slow cooling through the bottom OTS surface by natural convection. The temperature of the laboratory is controlled and constant at a value of 25 °C. The Si substrate temperature for the fast and slow cooling schemes is shown. From this boundary condition, the relevant values are the temperature difference between the Si substrate and the LC and the temperature difference within the LC. As shown in the results, these differences are of order 10−2 °C, which demonstrate that we do have a controlled-temperature setup for the LC.
Fig. S9.
BPII crystal nucleation and growth from an isotropic phase: cooling of a 12-μm-thick hybrid cell. Cross-polarized mode reflected light microscope images for 12-μm-thick hybrid cell during cooling from an isotropic phase at 42.8 °C for three cooling schemes: (A) a sudden temperature decrease to 40.8 °C; (B) an initial temperature decrease of 1 °C, followed by an additional one after 60 s; and (C) a slow stepwise cooling of 0.4 °C every 30 s. The reported temperature values are for the Si substrate.
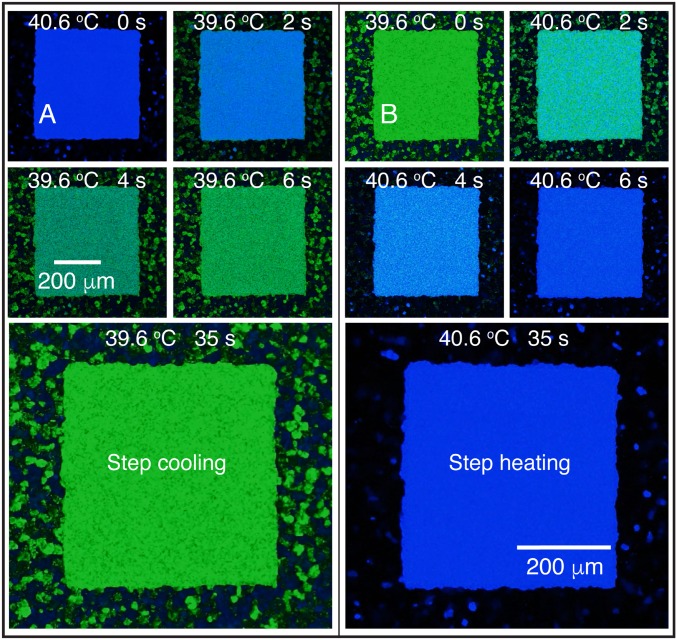
For the single-crystal BPII(100), which was obtained from the isotropic phase following the fast cooling scheme (as in Fig. 3A), the initial BPII(100) temperature, 40.6 °C, is held constant for a few minutes to achieve thermal equilibrium. The idea is to decrease the Si substrate temperature to trigger a BPII-to-BPI transition; once the LC temperature reaches 39.6 °C, the Si substrate is heated back to induce a BPI-to-BPII transition. Fig. 4 shows optical micrographs of the evolution of the phase transitions, taken in reflection mode with cross polarizers. In this experiment, the Si substrate temperature was changed from 40.6 to 39.6 °C in one step, and the BPII–BPI transition was completed within 8 s; the same was observed during a reverse 39.6–40.6 °C step heating, that is, a BPI–BPII transition. Two noteworthy observations are discussed here. First, the chemical patterns direct the formation of a single-crystal BPI from the perfect, single-crystal BPII, even though a stripe pattern was used. Second, within the patterned regions, the BP transitions appear to be homogenous, with nucleation and growth occurring within about 2 s (Movie S1).
Fig. 4.
Chemical pattern surface-mediated and directed BPI–BPII transformation. Results are shown for a hybrid cell with a striped chemical pattern. (A) Stepwise cooling from 40.6 to 39.6 °C to induce a BPII-to-BPI transformation; (B) stepwise heating from 39.6 to 40.6 °C, reversing the transformation shown in A. The BPI–BPII transition temperature is 40.4 °C. The reported temperatures are for the Si substrate.
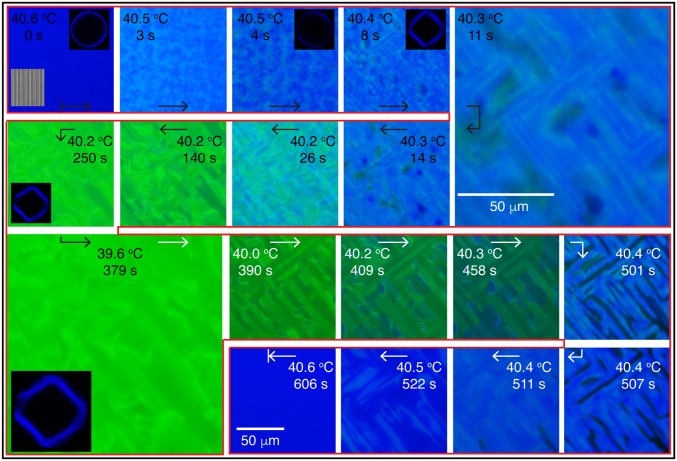
To gain additional insights over the course of these transitions, high-resolution images were obtained for slower cooling and heating rates. These are shown in Fig. 5. The cooling process is marked with black arrows, whereas the heating one is delineated with white arrows. Kossel diagrams are included at some temperatures to highlight the type of BP that is observed. Below the BPII–BPI transition temperature (40.5 °C), different arrays of blue stripes, reminiscent of a crosshatched structure, begin to appear over the patterned region. Those stripes are perpendicular to each other, and, at the same time, they maintain a 45° angle with respect to the underlying pattern. As the temperature continues to decrease, the dimensions of the crosshatched pattern become larger; the characteristic green color of the BPI starts to emerge, until it covers the entire area (around 39.6 °C). The resulting BPI is stable over time and is characterized by multiple grains with slightly different green tones. Once the heating starts, we observe that the size of the crosshatched stripes does not change appreciably, and that some blue color domains gradually appear and grow to form a single-crystal BPII(100). The final BPII phase, at 40.6 °C, is the same than the initial phase, serving to underscore that the transformations between BPs considered here are reversible (Movie S2). A previous report by Stegemeyer et al. (4) attributed the crosshatched structure to the mismatch between the crystalline symmetries of the BPs at the transition. We hypothesize that such a structure, including its long-range features and the observed collective motion, are a result of an underlying crystal reconfiguration process, from SC to BCC (and vice versa). The corresponding Kossel diagrams serve to identify the BP and their orientations: (i) the concentric ring pattern at 40.6 °C is produced by a monochromatic light reflection from the (1 0 0) planes in the BPII(100) and (ii) the diamond-like structure is produced by the (1 1 0) crystal orientation of BPI (34).
Fig. 5.
Dislocation and collective motion during BPI–BPII phase transformation. Results are shown for a hybrid cell with a striped chemical pattern. The cooling (black arrows) and heating (white arrows) were implemented in a stepwise manner. The reported temperature values are for the Si substrate. Kossel diagrams are shown to highlight the type of BP.
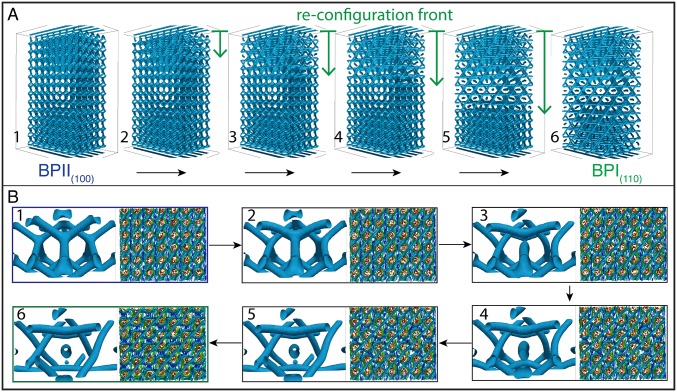
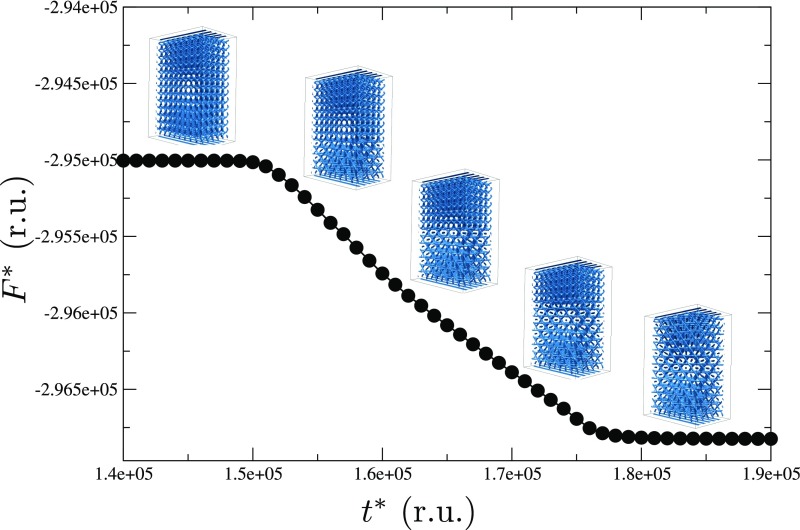
To arrive at a mechanistic interpretation of the underlying molecular processes for these transitions, we turn to large-scale simulations. More specifically, we examine how the network of topological defects behaves and reconfigures during the BPII(100)–BPI(110) phase transition by relying on Landau–de Gennes (LdG) theory for the tensor order parameter (details of the model and simulation approach are provided in Materials and Methods). In direct analogy to our experiments, the simulations start from a stable and single-crystal BPII(100) that is confined into a 2-μm-thick hybrid channel, with the striped chemical pattern on the bottom surface. The annealing process is performed by a slight change in temperature, followed by a free-energy relaxation, before the annealing process continues. The Ericksen number is given by , where γ1 is the rotational viscosity, v is the characteristic velocity of the backflow, H is a characteristic length, and L is the elastic constant (35). For our system, γ is 0.2 Pa⋅s (36), H = 3.5 μm (slab thickness), and L = 6 pN; to roughly estimate v, we use the time for the BPI–BPII transformation obtained from the experiments (2 s) and the size of the BPI lattice constant (300 nm), which gives v = 150 nm⋅s−1, these result in Er ∼ 0.0175, which is low enough to neglect backflow effects in our simulations. Fig. 6 provides representative configurations of the material as the structure evolves in time. Fig. 6A is meant to illustrate the process of defect reconfiguration and propagation for the network; a close-up of the system, showing a unit cell’s progression, is presented in Fig. 6B. Fig. S10 shows the evolution of the free energy at the BPII–BPI transformation; it predicts that, once the system reaches the BPII–BPI transition temperature, a sudden reconfiguration of the disclination lines takes place, starting from the top homeotropic surface. The time required in simulations for the BPII–BPI transformation is t* ∼ 3 × 10⁴, which corresponds to , which is a good agreement with the experimental observation when considering that H in our simulations is 2 μm. Note that the stripe pattern is designed to stabilize the BPII(100), and it is therefore to be expected that BPI formation will start from the nontreated homogeneous surface. We observe that the four-arm junctions of the BPII unfold and stretch to form straight-line defects; an increment in the space between the line defects is also observed during the transition (Fig. S11). Consistent with the experimental observations outlined above, the final topological structure corresponds to a BPI(110), and the phase transition occurs collectively, from top to bottom (Movie S3).
Fig. 6.
Reconfiguration of topological defects network during the BPII-to-BPI phase transformation. A temperature annealing is performed to match the experimental setup. (A) Evolution of the reconfiguration front from SC to BCC. (B) Unit cell and BP layer evolution during the transition.
Fig. S10.
Free-energy relaxation. Evolution of the free energy during the BPII–BPI transformation as a function of simulation time. Reported values are given in reduced units (r.u.).
Fig. S11.
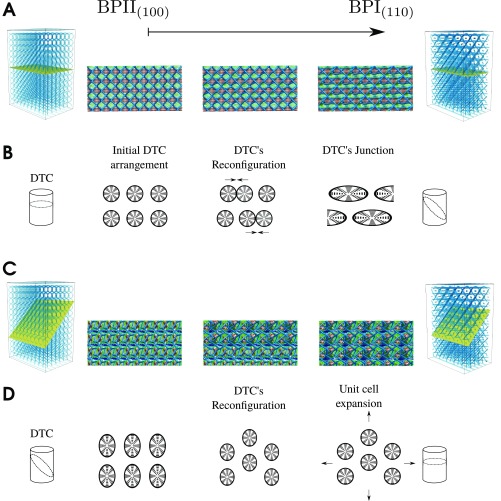
Reconfiguration of the double-twisted cylinder during the BPII–BPI transformation. (A) Representative sequence of director field images on a plane parallel to the patterned surface, showing how the double-twisted cylinders (DTCs) fuse over the course of the BPII(100)–BPI(110) transformation. (B) Schematic representation of the DTCs during the process shown in A. (C) Representative sequence of director field images on a plane parallel to the 110 plane, showing how the double-twisted cylinders (DTCs) reconfigure over the course of the BPII(100)–BPI(110) transformation. (D) Schematic representation of the DTCs during the process shown in C.
Discussion
Our chemical patterns, rectangular and striped, were engineered to seed the formation of BPI(110) and BPII(100), respectively; within the hybrid cell, they direct and promote formation of single-crystal BPs. The growth time for formation of single crystals is much shorter than that reported for monodomains in earlier studies; on rubbed polymer substrates, for example, several hours were necessary (24–28). The timescale for single-crystal growth is approximately 2 min for the BPII, and it is 1 h for the BPI when it is nucleated from a cholesteric phase (heating). These results suggest that the role of the stripe pattern goes beyond merely seeding a desired lattice orientation: it also increases the speed of the BPII nucleation and growth. Finally, we note that the viscosity of BPI is higher than that of BPII (5, 7), which serves to explain the reduced mobility and diffusion in BPI.
Because the BPI–BPII transition involves a transformation between two crystalline symmetries, it is of interest to draw analogies with transitions observed in solid crystals. In particular, the so-called martensitic transformations refer to diffusionless processes where a few atoms undergo a collective, highly coordinated motion. Because the flow of atoms is not required, there is no change in the atoms’ neighbors (1). For instance, in an austenite–martensite transformation, a BCC–FCC crystalline reorganization occurs. In contrast, the crystalline structure of BPs consists of double-twist cylinders arranged in a cubic symmetry, but having characteristic dimensions in the submicron regime. BP molecules are relatively free to move, and their preferred orientation depends on their position within the BP-cell; because they are liquid, molecular diffusion takes place incessantly. To compare the BCC–SC crystalline transformation produced by the BPI–BPII system with those occurring in solid crystals, we focus on the BP features responsible for the crystalline symmetry, namely, the ordered array of double-twisted cylinders. These cylinders are not rigid, individual entities, but rather well-defined molecular regions spanning tens of nanometers.
As shown in our simulations, during a diffusionless BPII(100)–BPI(110) transition, the arrangement of the double-twist cylinders, from SC to BCC, occurs through the collective motion of molecules inside the BP cells (Movie S3). BPs are crystalline, but they are liquid, and during the BPII–BPI transition the double-twist cylinders do not diffuse but fuse and merge to produce a new crystal symmetry through local molecular twist and reorientation (Fig. S11). Such a process involves a smooth reconfiguration of the corresponding disclination lines, and, in this case, the density of double-twisted cylinders is altered, thereby introducing or (removing) additional nearest neighbors. Solid crystal–crystal transitions are found to be strongly first order; the BPI–BPII transition, however, shows little temperature hysteresis (Fig. 4), and it appears simultaneously throughout the patterned area (Fig. 5). Previous experimental results (30) have shown that this transition involves latent heat, and it can be considered as weak first order. Our experiments and simulations support the view that, when viewed through the lens of the double-twisted cylinders, the BPI–BPII transformation could be considered to be a soft, mesoscopic martensitic transformation. There is not diffusion of the double-twist cylinders that form the crystalline structures, in analogy to atomic martensitic transformations, but a change in the number of double-twisted cylinder neighbors is involved. In addition, in contrast to the Chol–BPI and I–BPII transitions, it nucleates simultaneously throughout the patterned surface.
It is instructive to highlight several differences in the formation of BPs that arise between homogeneous nucleation (in the bulk) and heterogeneous nucleation (on patterned surfaces). As mentioned earlier, Henrich et al. (31) have shown that, during homogeneous nucleation, the formation of BPI starting from Chol, and the formation of BPII starting from Iso appear to follow a sequence of metastable states. In our calculations and experiments, the system is confined and the patterned surfaces act as the preferred nucleation site. They seed a specific BP-lattice orientation, thereby favoring formation of BP crystals having a particular orientation and their growth over the patterned region. When a given BP is formed, the transition to the other BP also occurs via a heterogeneous nucleation, indicating that properly patterned surfaces facilitate smooth transitions that do not appear to visit the metastable states that were identified in homogeneous processes.
Direct visualization of the underlying molecular events that characterize crystallization—how crystals are nucleated and grow—is particularly challenging. For crystalline BPs, the epitaxial assembly strategy presented here offers an opportunity to examine nucleation and growth over much longer length scales than accessible with molecular crystals. Furthermore, this can be done within the context of a liquid state, which is considerably more mobile than a solid. In the particular context of a crystal-to-crystal transition, we have shown that it is possible to undergo a transition from a perfect single crystal onto another in a fast and reversible manner—an observation that is without precedent for traditional soft materials, and which offers intriguing prospects for development of fast optical switches in optically pure materials over truly macroscopic domains. More generally, single-crystal BPs offer a rich and promising platform for studies of crystal nucleation and for control of growth dynamics in soft matter.
Materials and Methods
Materials.
MLC 2142 and 4-(1-methylheptyloxycarbonyl)phenyl-4-hexyloxybenzoate (S-811) were purchased from Merck. OTS, heptane, toluene, chlorobenzene, 1-methyl-2-pyrrolidinone, anisole, n-amyl acetate, isopropyl alcohol, and dichloromethane (DCM) were purchased from Sigma-Aldrich and used without further purification. Glass microscope slides were purchased from Fisher Scientific in the finest premium grade. One-minute epoxy glue was obtained from Henkel.
Preparation of BP Materials.
The 36.32 wt% S-811 in MLC 2142 mixtures were prepared by using toluene as a cosolvent. After mixing with an ultrasonic cleaner, toluene was evaporated overnight under vacuum at 50–55 °C.
Preparation of PMMAZO Brush Chemical Patterns.
A 4- to 5-nm-thick 6-(4-methoxyazobenzene-4′-oxy)hexyl-methacrylate (MMAZO) film was deposited on an oxygen plasma-cleaned silicon substrate by spin-coating from a 0.05 wt% toluene solution and annealed at 250 °C for 5 min under vacuum. During the annealing, hydroxyl groups in PMMAZO reacted with the silanol groups of the native oxide through a dehydration reaction, forming a brush layer on the substrate. Nongrafted PMMAZO was removed by sonication in toluene, and the remaining PMMAZO brush was measured to be around 4.5 nm in thickness. A 40-nm-thick GL2000 photoresist film was deposited onto the PMMAZO brush and baked at 160 °C for 5 min. Striped patterns were exposed on the resists using electron beam lithography with the JEOL 9300FS electron beam writer at the Center for Nanoscale Materials, Argonne National Laboratory. Exposed substrates were developed with n-amyl acetate for 15 s and rinsed with isopropyl alcohol. The resulting resist pattern was transformed into a chemical pattern on the PMMAZO brush layer by exposing the sample to an oxygen plasma, followed by stripping the GL2000 photoresist in chlorobenzene (37).
Preparation of Optical Cells.
The glass microscope slides were boiled in a piranha solution [7:3 (vol/vol) of 98% H2SO4/30% H2O2] for 30 min, to remove any stains on the surface, washed with deionized water, and dried with nitrogen. The cleaned glass slides were immersed in a mixture of 13.8 μL of OTS and 120 mL of heptane. After 30 min, they were removed from the OTS solution, washed with DCM several times, and quickly dried under a nitrogen flow. The OTS glass and the Si substrate with the PMMAZO chemical patterns were placed face-to-face with 3.5-μm Myler spacer. The optical cell and the LC were heated above the isotropic temperature (∼65 °C) and mixture of 2142/S-811 was injected through capillary action. The system was then slowly cooled down to room temperature.
Characterization.
The thickness of the PMMAZO brush was measured by a Woollam VUV-VASE32 variable-angle spectroscopic ellipsometer. Optical characterization was performed using cross-polarized and reflection mode with an Olympus BX60 microscope with a 10× objective. Samples were heated up to the isotropic phase using Bioscience Tools TC-1-100s temperature controller controlling hot stage at different rates. UV–vis spectra of BP films were carried out using a spectrophotometer (USB4000; Ocean Optics). Kossel diagrams were used to identify the type of BP and determine the crystal orientation.
Simulations.
The LCs considered here are described in terms of the tensorial representation of the mean-field LdG free-energy model. The details of the simulations are given in the Supporting Information.
BP Crystal Nucleation and Growth from a Cholesteric Phase: Heating
Our experimental platform offers the possibility to control, measure, and visualize the dynamics of crystal growth during the underlying phase transitions toward formation of a macroscopic single-crystal BP. We start by heating the hybrid cell from a cholesteric phase and examine the sequence of transitions: Chol → BPI → BPII for the case of the rectangular array and Chol → BPI → BPII → I for the case of the striped array. A finite-element analysis was carried out to determine the temperature gradients that arise within the LC hybrid cell, and between the Si substrate and the LC (details of the heat transfer setup used for our heating or cooling analysis are provided in Fig. S6). We start by heating a cholesteric phase from 25 to 39.6 °C; during this process, no visible effects were observed. A heating rate of 0.5 °C/min was used to reach 39.6 °C. At this point, we changed to a slower heating rate, consisting of a series of temperature-holding steps, to increase the temperature by 0.1 °C every 5 min.
Fig. 2 shows micrographs of the heating progression through cross-polarizers, taken in reflection mode. Fig. 2A corresponds to the sequence of images when the rectangular pattern is used to direct the formation of a single-crystal BPI; Fig. 2B shows the heating sequence for the striped pattern that directs the formation of BPII. For the range of temperatures from 25 to 39.6 °C, the cholesteric LC is not affected by the chemical patterns. In the cell with the rectangular patterns, however, when the temperature reaches 39.7 °C the nucleation of BPI domains is clearly observed throughout the entire cell, including the nonpatterned regions. As the temperature is slightly increased, the small BPI(100) domains (characterized by the lighter green color) grow and merge to produce a uniform green domain. In contrast, outside the patterned region, small domains of both BPI(110) and BPI(200) grow and produce a mixture of green and blue platelets. Once the temperature reaches 40.3 °C, the entire patterned area gradually becomes a single-crystal BPI(110) characterized by a dense, uniform green color. In our experiments, the time required for BPI nucleation (T ∼ 39.7 °C) and single-crystal growth (T ∼ 40.3 °C) is ≈30 min. The BPI–BPII transition occurs at ∼40.5 °C, at which point the entire patterned area starts to appear dark (the transition is marked by a red square). Consistent with our expectations (14), when the BPII(111) is formed under this strong degree of confinement, the chemical patterns induce a hexagonal BP in the immediate proximity of the treated surface (Fig. S6), as confirmed by the corresponding Kossel diagram. The BPII(111) phase is formed at 40.6 °C; the darkness arises from the fact that the light reflection from the (1 1 1) plane is outside the visible range [i.e., nm]. Note that the region outside the patterned area is always polycrystalline. To examine the effects of the heating rate on the growth process, we also consider a faster stepping rate, of 0.2 °C every 2 min for the rectangular pattern (Fig. S7A). In the low-temperature regime (<40.0 °C), small BPI(110) domains grow without realignment and produce a monodomain. The entire process to produce the monodomain sample takes ≈2.5 min. Some BPI(200) platelets are also formed, which have a blue color since the light is reflected from the (2 0 0) plane. These observations indicate that a slow heating rate allows BPI(110) platelets to realign into a common xy direction, and eventually connect over the entire pattern area to forming a single-crystal BP.
Fig. S7.
BP crystal nucleation and growth from a cholesteric phase: heating. Hybrid cell cross-polarized mode reflective light microscope images during the formation of BPs from a cholesteric phase by heating. (A) The rectangular pattern is used with heating from below; the temperature is increased by 0.2 °C every 2 min. (B) Stripe-like pattern, for a heating rate of 0.2 °C every minute.
On the striped patterns (Fig. 2B), the BPI nucleation starts at T ∼ 39.8 °C. Between 39.8 and 40.3 °C, a mixture of the BPI(110) and BPI(200) phases coexist, producing green and blue platelets. In this BPI regime, the patterns are unable to direct the formation of a single-crystal BPI. At the BPI–BPII transition, a “fast” nucleation of a single-crystal BPII domain occurs within the span of 2 min, at 40.4 °C. The patterned area is immediately and completely covered by a dense and uniform blue color produced by a BPII(100) single-crystal domain that reflects light with nm. The reference homeotropic background outside the patterned region remains polycrystalline, where dark domains correspond to BPII(110), and BPII(111) domains do not reflect visible light. The single-crystal BPII domain structure disappears when the system reaches the isotropic temperature (T ∼ 43.0 °C). In contrast to observations with the rectangular array, using a faster heating stepping rate, of 0.2 °C every minute (Fig. S7B), on a striped pattern a single-crystal BPII(100) with a uniform and dense blue color is also produced at T ∼ 40.6 °C.
BPII Crystal Nucleation and Growth from an Isotropic Phase: Cooling
We now examine the nucleation, growth, and formation of a BPII(100) phase from an isotropic phase during cooling. The initial uniform temperature of the isotropic liquid is 42.8 °C. Three cooling schemes are considered: (i) a sudden decrease to 40.8 °C; (ii) a sudden decrease to 41.8 °C, followed by a decrease of 1 °C after 1 min; and (iii) a decrease of 0.4 °C every 30 s. Fig. 3 summarizes our results for all three cooling schemes. Note that the 3.5-μm cell is cooled from below. It also undergoes natural convection cooling at the top, but the low thermal conductivity and the thickness of the top glass direct the heat flow through the bottom Si substrate (additional details are provided in Supporting Information). This experiment serves to determine the nucleating mechanism in our hybrid cell. Surface-mediated nucleation will favor BPII(100) formation from the patterned surface, and BPII(111) formation from the top surface (Fig. S2).
When the temperature is decreased suddenly from 42.8 to 40.8 °C, small (2–5 μm) domains of BPII(100) start to form throughout the patterned area (Fig. 3A). After 15 s, the nucleation sites grow to provide a uniform blue-colored sample, and they merge to form a single-crystal BPII(100) after 60 s. For reference, the surrounding homeotropic area contains few blue platelets and is dominated by the formation of black regions. Recall that no visible light is reflected from the (1 1 1) or (1 1 0) planes of the BPII that is formed in these experiments. Note that the final BPII(100) is stable over prolonged observations and does not contain any grain boundaries, reinforcing the fact that the samples represent a single crystal. For this cooling scheme, the nucleation events from the chemical pattern dominate the BPII crystallization. If the temperature is decreased at a lower rate, the top glass surface and the bulk have sufficient time to influence the BPII crystallization. This is the rationale behind the cooling schemes ii and iii, whose results are shown in Fig. 3 B and C, respectively. A slow stepwise cooling allows the BPII crystallization process to be dominated by a surface-mediated mechanism that grows from the top surface. Therefore, in contrast to observations from the fast rate process, dark crystals dominate the nucleation and growth of the BPII, resulting in a stable and completely dark BPII(111) specimen (Fig. 3C). For an intermediate cooling rate, a competition arises between the patterned and top substrates; the final BPII is polycrystalline, consisting of multiple domains oriented in different directions, as can be appreciated from the blue platelets and dark grains in Fig. 3B.
The results presented above serve to establish that the cooling process and the strength of the confinement (the surface-to-bulk ratio) can be manipulated to engineer the formation of single-crystal BPs. In what follows, we further explore this hypothesis by relying on two additional hybrid cells, with thicknesses of 1.5 and 12 μm. We use the same cooling schemes as before. The results of the corresponding measurements are summarized in Figs. S8 and S9. For the thinner cell, a single-crystal BPII(100) is formed, following the same nucleation mechanism (seed, grow, and collapse), for the fast and medium cooling schemes. The only difference is the time required to form the crystal. On the other hand, for the slower rate, the dark BPII(111) is formed. These observations with the thinner cell confirm that the surfaces mediate the crystallization; the cooling rate and the chemical pattern are the key control variables. In contrast, for the thicker cell, only for the fast rate can one direct the formation of a single-crystal BPII(100). A polycrystalline BPII is formed using the medium and slower rates, thereby suggesting that, in addition to the surface-mediated crystallization, a homogeneous mechanism is also at play. This observation comes from the high density of dark grains in the final crystals.
Fig. S8.
BPII crystal nucleation and growth from an isotropic phase: cooling–1.5-μm-thick hybrid cell. Cross-polarized mode, reflective light microscope images during cooling of 1.5-μm-thick hybrid cell, from an isotropic phase at 42.8 °C for three cooling schemes. (A) A sudden temperature decrease to 40.8 °C; (B) An initial temperature decrease of 1 °C, followed by an additional decrease after 60 s; and (C) slow stepwise cooling of 0.4 °C every 30 s, and corresponding Kossel diagram for the final BPII state. The reported temperature values are for the Si substrate.
Simulations
The LCs considered here are described in terms of the tensorial representation of the mean-field Landau–de Gennes free-energy model (2, 38, 39). The tensor order parameter, Qij, is defined by Qij = S (ni nj −1/3 δij), where i, j = 1, 2, 3, and ni are the x, y, z components of the local director vector; S is the scalar-order parameter, given by S = <3/2 cos2θ −1/2>, with cos θ = a⋅n, where a is the molecular orientation and “<>” denotes a spatial average. The total free energy of the system, F(Q), is expressed as follows:
| [S1] |
where the short-range contribution is given by the following:
| [S2] |
In Eq. S2, A and U are material parameters that depend on temperature and pressure (13,16, 38). The long-range elastic contributions to the free energy are given by the following:
| [S3] |
where εikl is the Levi–Civita tensor, and q0 = 2π/p is the inverse of the pitch and measures the chirality of the system. Li’s are the elastic constant of the LC. The last term of Eq. S1 corresponds to the surface contributions to the free energy. The surface free energy fs is given by a Fournier–Galatola expression (40) of the form, , where Wp is the degenerate planar anchoring strength; and , where P is the projection operator and ν is the vector normal to the surface. When a homeotropic anchoring is considered, surface contributions to the free energy are given by the following: , where WH is the homeotropic anchoring energy and Q0 is a surface-preference tensor order parameter.
The following values, which are well in the range expected for common chiral LCs, were used for all calculations: A = 1.067 × 10⁵ J/m3, L1 = 6 pN, and L5 = 2L1 (2, 14, 20). A lattice array with mesh size of 7.5 nm was used to perform the simulations. The minimization of the free energy was achieved by means of the Euler–Lagrange equation with appropriate boundary conditions; additional details can be found in the literature (39, 41–43). For the annealing process, the simulations started from an equilibrated BPII with U = 2.755 and chiral pitch P = 258 nm. Since the reduced temperature is τ = 9(3 − U)/U, we decrease the system’s temperature by increasing U and by letting the system relax after each increment of U. The BPII–BPI transition was observed for U = 3.45 (the last U increment was 0.02). The BP unit cell parameter depends on the pitch and is given by aBPI = p/(√2r) and aBPII = p/(2r), where r is a parameter known as red shift whose value is 0.86 for BPII and 0.71 for BPI [these values match the experimental measurements of the corresponding lattice constants (15)]. The size of the simulation box was Lz = 2.0 μm in thickness, and the surface area dimensions Lx and Ly were chosen to be close integer values of multiples of aBPI and aBPII at the same time.
Supplementary Material
Acknowledgments
We thank Dr. Leonidas E. Ocola for help using the JEOL 9300FS electron beam writer and Dr. Jiaxing Ren for useful discussions. We gratefully acknowledge support from the US Department of Energy (DOE), Basic Energy Sciences, Materials Sciences and Engineering Division. This research used resources from the Center for Nanoscale Materials, a DOE Office of Science User Facility operated for the DOE Office of Science by Argonne National Laboratory under Contract DE-AC02-06CH11357. We acknowledge the University of Chicago Research Computing Center for computing time and assistance. We acknowledge the Materials Research Science and Engineering Center Shared User Facilities at the University of Chicago (National Science Foundation Grant DMR-1420709). J.P.H.-O. thanks Departamento Administrativo de Ciencia, Tecnología e Innovación for funding this research through Contract 110-165-843-748 with funds from “El Patrimonio Autónomo Fondo Nacional de Financiamiento para la Ciencia, la Tecnología y la Innovación Francisco José de Caldas.”
Footnotes
The authors declare no conflict of interest.
This article is a PNAS Direct Submission.
This article contains supporting information online at www.pnas.org/lookup/suppl/doi:10.1073/pnas.1711207114/-/DCSupplemental.
References
- 1.Porter DA, Easterling KE, Sherif M. Phase Transformations in Metals and Alloys. CRC Press; Boca Raton, FL: 2009. pp. 383–387. [Google Scholar]
- 2.Wright DC, Mermin ND. Crystalline liquids: The blue phases. Rev Mod Phys. 1989;61:385–433. [Google Scholar]
- 3.Crooker PP. The cholesteric blue phase: A progress report. Mol Liq Cryst. 1983;98:31–45. [Google Scholar]
- 4.Stegemeyer H, Blumel T, Hiltrop K, Onusseit H, Porsch F. Thermodynamic, structural and morphological studies on liquid-crystalline blue phases. Liq Cryst. 1986;1:3–28. [Google Scholar]
- 5.Crooker PP. Chirality in Liquid Crystals. Springer; Berlin: 2001. pp. 186–222. [Google Scholar]
- 6.Oswald P, Pieranski P. Nematic and Cholesteric Liquid Crystals. Taylor and Francis; Boca Raton, FL: 2005. pp. 493–547. [Google Scholar]
- 7.Hirotsugu K. Liquid Crystalline Blue Phases. Springer; Berlin: 2008. pp. 99–117. [Google Scholar]
- 8.Xiang J, Lavrentovich OD. Blue-phase-polymer-templated nematic with sub-millisecond broad-temperature range electro-optic switching. Appl Phys Lett. 2013;103:051112. [Google Scholar]
- 9.Castles F, et al. Stretchable liquid-crystal blue-phase gels. Nat Mater. 2014;13:817–821. doi: 10.1038/nmat3993. [DOI] [PubMed] [Google Scholar]
- 10.Castles F, et al. Blue-phase templated fabrication of three-dimensional nanostructures for photonic applications. Nat Mater. 2012;11:599–603. doi: 10.1038/nmat3330. [DOI] [PubMed] [Google Scholar]
- 11.Lin T-H, et al. Red, green and blue reflections enabled in an optically tunable self-organized 3D cubic nanostructured thin film. Adv Mater. 2013;25:5050–5054. doi: 10.1002/adma.201300798. [DOI] [PubMed] [Google Scholar]
- 12.Sato M, Yoshizawa A. Electro-optical switching in a blue phase III exhibited by achiral liquid crystal oligomer. Adv Mater. 2007;19:4145–4148. [Google Scholar]
- 13.Yokoyama S, Mashiko S, Kikuchi H, Uchida K, Nagamura T. Laser emission from a polymer-stabilized liquid-crystalline blue phase. Adv Mater. 2006;18:48–51. [Google Scholar]
- 14.Martínez-González JA, et al. Blue-phase liquid crystal droplets. Proc Natl Acad Sci USA. 2015;112:13195–13200. doi: 10.1073/pnas.1514251112. [DOI] [PMC free article] [PubMed] [Google Scholar]
- 15.Bukusoglu E, Wang X, Martínez-González JA, de Pablo JJ, Abbott NL. Stimuli-responsive cubosomes formed from blue phase liquid crystals. Adv Mater. 2015;27:6892–6898. doi: 10.1002/adma.201503484. [DOI] [PubMed] [Google Scholar]
- 16.Kikuchi H, Yokota M, Hisakado Y, Yang H, Kajiyama T. Polymer-stabilized liquid crystal blue phases. Nat Mater. 2002;1:64–68. doi: 10.1038/nmat712. [DOI] [PubMed] [Google Scholar]
- 17.Fukuda J. Stability of cholesteric blue phases in the presence of a guest component. Phys Rev E Stat Nonlin Soft Matter Phys. 2012;86:041704. doi: 10.1103/PhysRevE.86.041704. [DOI] [PubMed] [Google Scholar]
- 18.Rožič B, et al. Theoretical and experimental study of the nanoparticle-driven blue phase stabilisation. Eur Phys J E Soft Matter. 2011;34:17. doi: 10.1140/epje/i2011-11017-8. [DOI] [PubMed] [Google Scholar]
- 19.Hiroyuki Y, et al. Nanoparticle-stabilized cholesteric blue phases. Appl Phys Express. 2009;2:121501. [Google Scholar]
- 20.Hur S-T, Gim M-J, Yoo H-J, Choi S-W, Takezoe H. Investigation for correlation between elastic constant and thermal stability of liquid crystalline blue phase I. Soft Matter. 2011;7:8800–8803. [Google Scholar]
- 21.Kasch N, Dierking I, Turner M. Stabilization of the liquid crystalline blue phase by the addition of short-chain polystyrene. Soft Matter. 2013;9:4789–4793. [Google Scholar]
- 22.Kemiklioglu E, Hwang JY, Chien LC. Stabilization of cholesteric blue phases using polymerized nanoparticles. Phys Rev E Stat Nonlin Soft Matter Phys. 2014;89:042502. doi: 10.1103/PhysRevE.89.042502. [DOI] [PubMed] [Google Scholar]
- 23.Guo J. Stabilizing blue phases of a simple cyanobiphenyl compound by addition of achiral mesogen monomer with a branched end group and chiral hydrogen-bonded assemblies. J Mater Chem C Mater Opt Electron Devices. 2013;1:947–957. [Google Scholar]
- 24.Nayek P, et al. Tailoring monodomain in blue phase liquid crystal by surface pinning effect. Appl Phys Express. 2012;5:051701. [Google Scholar]
- 25.Yan J, Wu S-T, Cheng K-L, Shiu JW. A full color reflective display using polymer-stabilized blue phase liquid-crystal. Appl Phys Lett. 2013;102:081102. [Google Scholar]
- 26.Claus H, et al. Inducing monodomain blue phase liquid crystals by long-lasting voltage application during temperature variation. Liq Cryst. 2016;43:688–693. [Google Scholar]
- 27.Kim K, et al. A well-aligned simple cubic blue phase for a liquid crystal laser. J Mater Chem C Mater Opt Electron Devices. 2015;3:5383–5388. [Google Scholar]
- 28.Chen M, Lin Y-H, Chen H-S, Chen H-Y. Electrically assisting crystal growth of blue phase liquid crystals. Opt Mater Express. 2014;4:953–959. [Google Scholar]
- 29.Chen P-J, Chen M, Ni S-Y, Chen H-S, Lin Y-H. Influence of alignment layers on crystal growth of polymer-stabilized blue phase liquid crystals. Opt Mater Express. 2016;6:1003–1010. [Google Scholar]
- 30.Thoen J. Calorimetric studies of liquid crystal phase transitions: Steady-state adiabatic techniques. In: Chester AN, Martellucci S, editors. Phase Transition in Liquid Crystals. Springer Science+Business Media; New York: 1992. pp. 161–163. [Google Scholar]
- 31.Henrich O, Stratford K, Marenduzzo D, Cates ME. Ordering dynamics of blue phases entails kinetic stabilization of amorphous networks. Proc Natl Acad Sci USA. 2010;107:13212–13215. doi: 10.1073/pnas.1004269107. [DOI] [PMC free article] [PubMed] [Google Scholar]
- 32.Ji S, et al. Three-dimensional directed assembly of block copolymers together with two-dimensional square and rectangular nanolithography. Adv Mater. 2011;23:3692–3697. doi: 10.1002/adma.201101813. [DOI] [PubMed] [Google Scholar]
- 33.Martínez-González JA, et al. Directed self-assembly of liquid crystalline blue-phases into ideal single-crystals. Nat Commun. 2017;8:15854. doi: 10.1038/ncomms15854. [DOI] [PMC free article] [PubMed] [Google Scholar]
- 34.Hauser A, Thieme M, Saupe A, Heppke G, Krerke D. Surface-imaging of frozen blue phases in a discotic liquid crystal with atomic force microscopy. J Mater Chem. 1997;7:2223–2229. [Google Scholar]
- 35.Zhang R, Roberts T, Aranson IS, de Pablo JJ. Lattice Boltzmann simulation of asymmetric flow in nematic liquid crystals with finite anchoring. J Chem Phys. 2016;144:084905. doi: 10.1063/1.4940342. [DOI] [PubMed] [Google Scholar]
- 36.Liu QF, Luo D, Li SX, Tian Z. The birefringence and extinction coeffient of positive and negative liquid crystals in the terahertz range. Liq Cryst. 2016;43:796–802. [Google Scholar]
- 37.Li X, et al. Directed self-assembly of nematic liquid crystals on chemically patterned surfaces: Morphological states and transitions. Soft Matter. 2016;12:8595–8605. doi: 10.1039/c6sm01733a. [DOI] [PubMed] [Google Scholar]
- 38.Grebel H, Hornreich RM, Shtrikman S. Landau theory of cholesteric blue phases. Phys Rev A. 1984;30:3264–3278. [Google Scholar]
- 39.Ravnik M, Zumer S. Landau-de Gennes modelling of nematic liquid crystals colloids. Liq Cryst. 2009;36:1201–1214. [Google Scholar]
- 40.Fournier J, Galatola P. Modeling planar degenerate wetting and anchoring in nematic liquid crystals. Europhys Lett. 2005;72:403–409. [Google Scholar]
- 41.Ravnik M, Alexander GP, Yeomans JM, Zumer S. Mesoscopic modelling of colloids in chiral nematics. Faraday Discuss. 2010;144:159–169, discussion 203–222, 467–481. doi: 10.1039/b908676e. [DOI] [PubMed] [Google Scholar]
- 42.Dupuis A, Marenduzzo D, Yeomans JM. Numerical calculations of the phase diagram of cubic blue phases in cholesteric liquid crystals. Phys Rev E Stat Nonlin Soft Matter Phys. 2005;71:011703. doi: 10.1103/PhysRevE.71.011703. [DOI] [PubMed] [Google Scholar]
- 43.Alexander GP, Yeomans JM. Numerical results for the blue phases. Liq Cryst. 2009;36:1215–1227. [Google Scholar]
Associated Data
This section collects any data citations, data availability statements, or supplementary materials included in this article.


