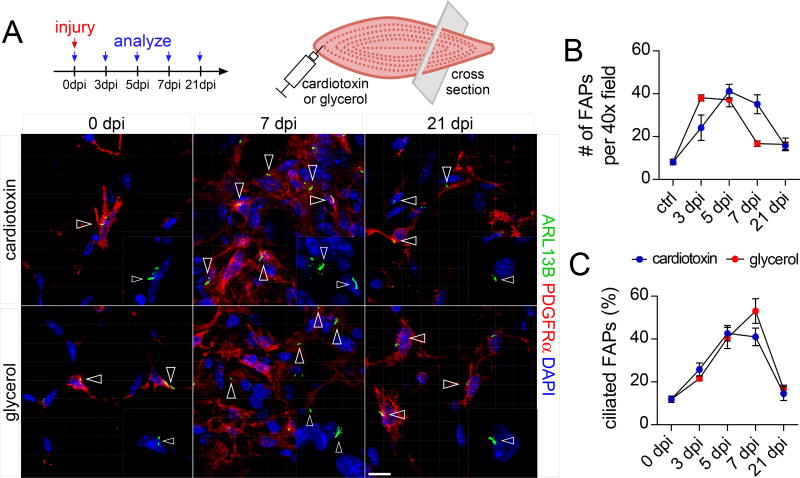
Figure 1. FAPs are dynamically ciliated during muscle regeneration.
(A) Immunofluorescence for cilia (ARL13B, green) and FAPs (PDGFRα, red) at the indicated time points after injury with cardiotoxin (top row) or glycerol (bottom row) of the tibialis anterior muscle of wild type mice (n=3–7 mice per time point and per injury). Ciliated FAPs are marked by arrowheads. Nuclei are stained with DAPI (blue). Scale bar is 10 µm.
(B) Quantifications of the total number of FAPs present per 40x view at the indicated time points after injury (n=3–7 mice per time point and per injury).
(C) Quantifications of the percentage of ciliated FAPs over total FAPs (n=3–7 mice per time point and per injury). All data are represented as mean ± SEM. See also Figure S1.

