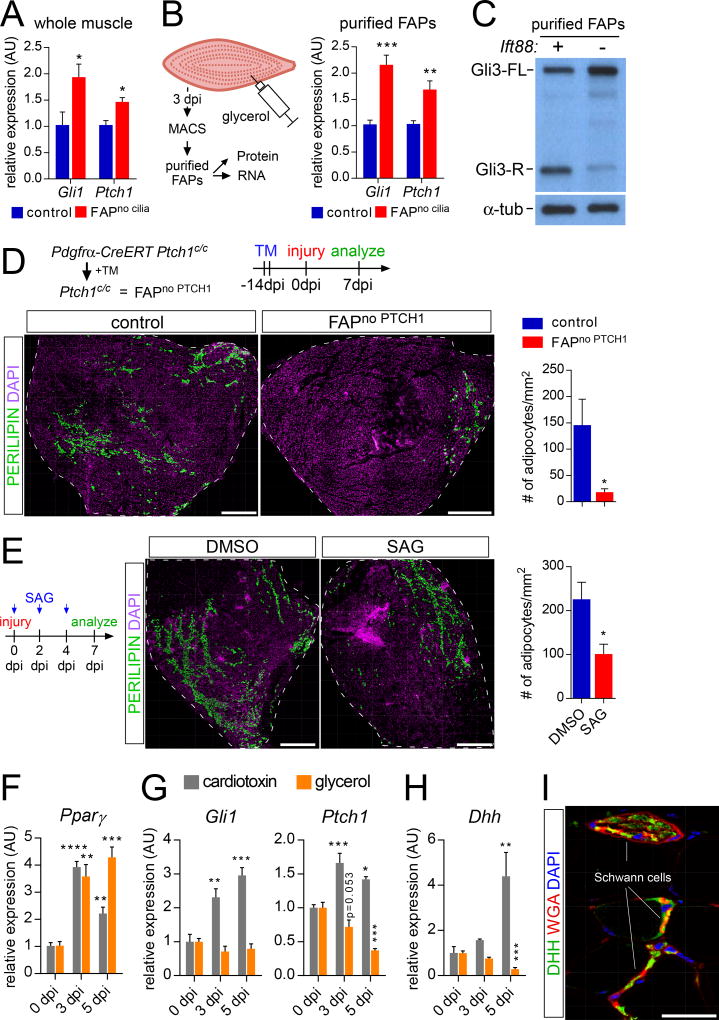
Figure 4. FAP cilia repress Hh target genes.
(A) Gli1 and Ptch1 RT-qPCR from whole muscle of control (n=4) and FAPno cilia mice (n=4) 5 dpi with glycerol injection.
(B) Gli1 and Ptch1 RT-qPCR from MACS-purified FAPS of control (n=5) and FAPno cilia mice (n=6) 3 dpi with glycerol injection.
(C) Immunoblotting for GLI3 and α-TUBULIN (loading control) on whole cell protein lysates from MACS-purified FAPs of control and FAPno cilia mice at 3 dpi with glycerol injection (n=10–12 per genotype per sample).
(D) Immunofluorescence for adipocytes (PERILIPIN, green) after conditional removal of Ptch1 in FAPs 7 dpi with glycerol injection. Scale bar is 500 µm. Right: Quantifications of the number of adipocyte present per 1 mm2 of injured muscle from control (n=7) and FAPno PTCH1 (n=7) mice 7 dpi.
(E) Immunofluorescence of adipocytes (PERILIPIN, green) of wild type mice tibialis anterior muscle 7 dpi with injection of glycerol and either DMSO or SAG at day 0, 2 and day 4. Scale bar is 500 µm. Right: Quantifications of number of adipocytes per mm2 of injured area 7 dpi (n= 5–9 per treatment group).
(F–I) RT-qPCR analysis of RNA isolated from whole tibialis anterior muscle without injury or 3 and 5 dpi with injection of cardiotoxin (gray) or glycerol (orange) (n=4 per time point and injury) for (F) Pparγ, (G) Gli1 and Ptch1 and (H) Dhh.
(I) Immunofluorescence for DHH (green) and Schwann cells (WGA, red) in uninjured tibialis anterior muscle. Scale bar is 50 µm. All data are represented as mean ± SEM. See also Figure S4.

