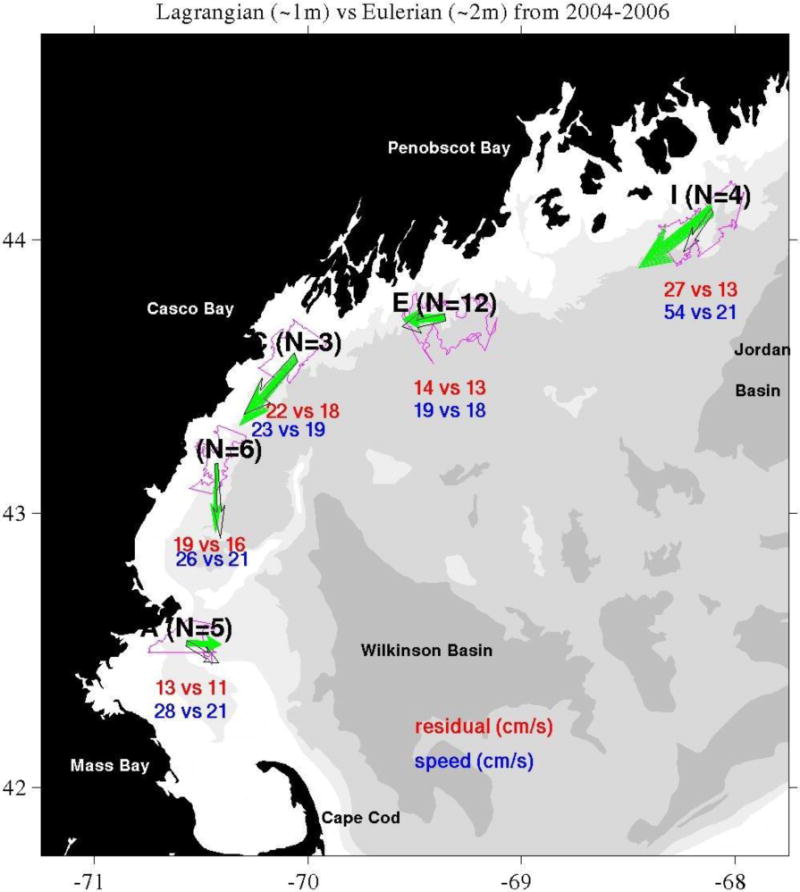
Figure 3.

Lagrangian (green arrows) vs Eulerian (black arrows) residual (average over tidal periods) velocity. Values are posted in red along with the mean speeds in blue. Some of the geographic features referred to in the text are posted on this plot as well.
