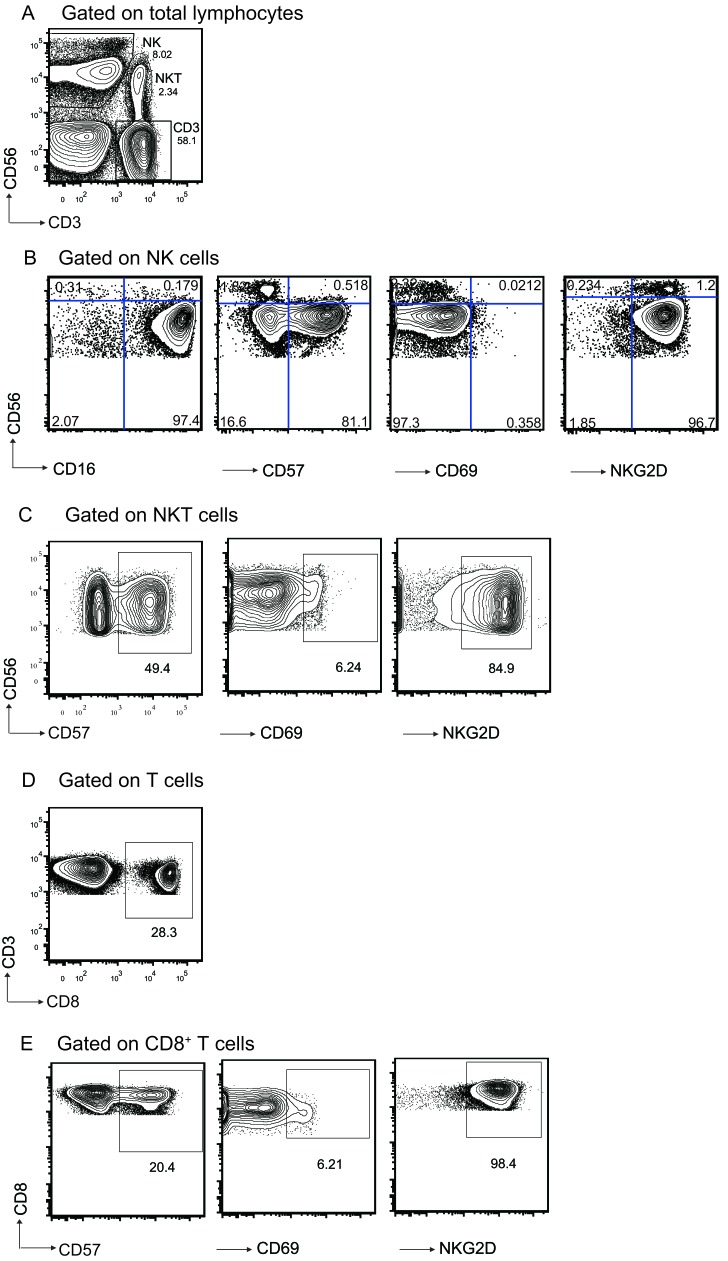
Figure 2. Gating strategy and representative flow cytometric analysis of lymphocytes populations form the subjects. A.
Identification of different cell populations in PBL based on CD3 and CD56 expression. NK cells(CD3-CD56+); classical T cells (CD3+CD56-); NKT cells (CD3+CD56+). Frequency of each cell population is shown beside the population. B. Gated on CD3-CD56+ NK cells. CD16, CD57, CD69, and NKG2D expression level on NK cells were shown. C. Gated on CD3+CD56+ NKT cells. CD57, CD69, and NKG2D expression on NKT cells were shown. D. CD8 expression on CD3+CD56- T cells. E. Gated on CD8+ T cells. CD57, CD69, and NKG2D expression on CD8+ T cells were shown. Numbers represent the proportions of the indicated molecules in the gated cell populations.

