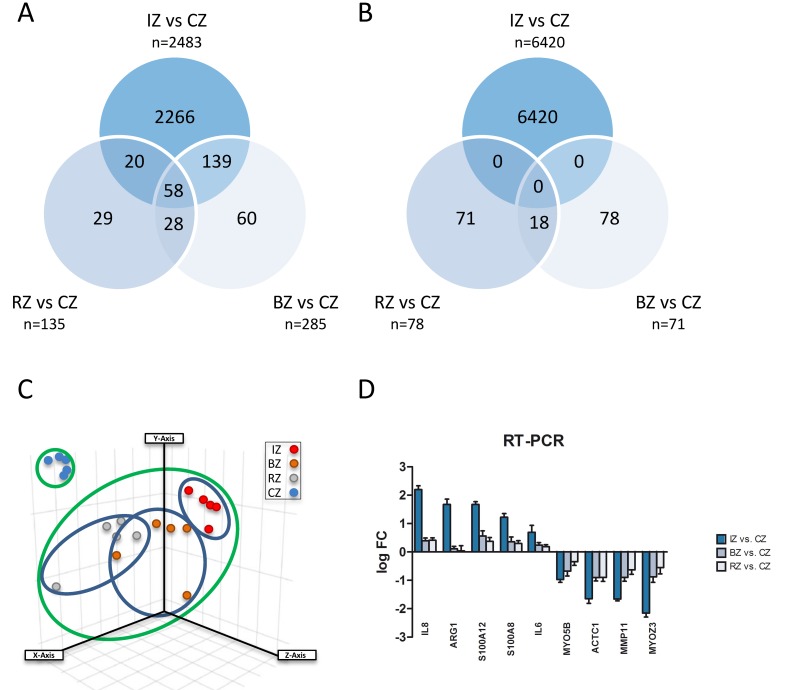
Figure 2.
A. Venn diagram showing up-regulated genes with significant changes in all three areas of myocardium 24h after induction of acute myocardial infarction compared to control myocardium (CZ). Infarct core zone (IZ, n = 2483); border zone (BZ, n = 285); remote myocardium zone (RZ, n = 135). B. Venn diagram showing downregulated genes with significant changes in all three areas of myocardium 24h after induction of acute myocardial infarction compared to control myocardium (CZ). Infarct core zone (IZ, n = 6420); border zone (BZ, n = 71); remote myocardium zone (RZ, n = 78). C. Principal Component Analysis displaying mRNA expression data of the different areas of infarcted hearts and untreated healthy hearts. Infarct core zone (IZ, red dots); border zone (BZ, orange dots); remote myocardium (RZ, grey dots); control zone (CZ, blue dots). D. Validation of microarray results by RT-PCR. mRNA levels of nine selected genes were quantified by RT-PCR. Shown are mean ± SD of log FC values. RT-PCR data were normalized to beta-actin.

