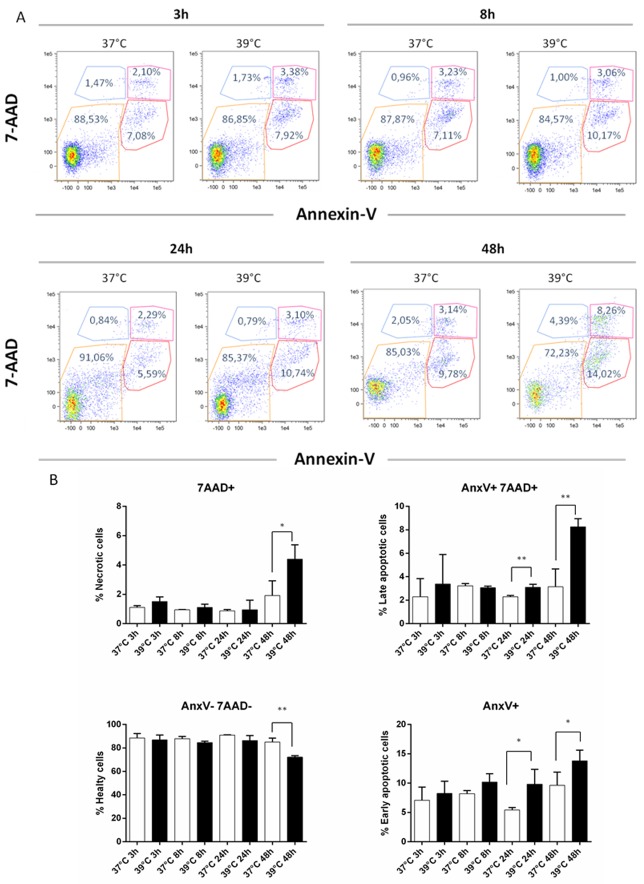
Figure 4. Apoptosis and necrosis induction by hyperthermia.
DCs were analyzed for necrosis/apoptosis levels after exposure to hypertermic conditions for different time points. A. Representative AnnexinV versus 7-AAD dot plots of DCs after 3, 8, 24 and 48 h of exposure to normal and hyperthermic conditions are shown. B. The percentages of healthy (Annexin V- and 7-AAD-), necrotic (Annexin V+ and 7-AAD+), early (Annexin V+ and 7-AAD-) and late apoptotic (Annexin V- and 7-AAD+) cells are shown as mean ± SEM of three independent experiments. *p < 0.05; **p < 0.001. Statistical comparisons were made using paired data Student’s t-test.

