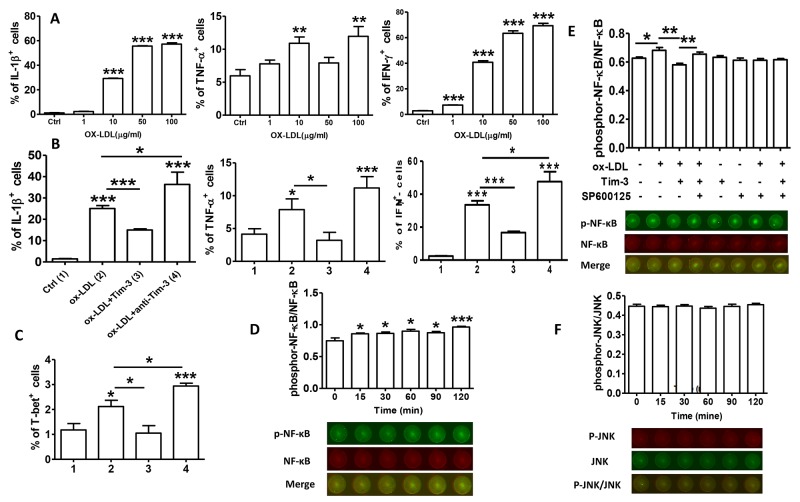
Figure 4. Tim-3 protects HUVECs from ox-LDL-induced proinflammatory response via NF-κB inhibition.
(A) Quantitation of flow cytometric analysis of the indicated proinflammation cytokines (IL-1β, TNF-α, and IFN-γ) in HUVECs stimulated with different concentrations of ox-LDL (0, 1, 10, 50, and 100 μg/mL). (B and C) Quantitation of flow cytometric analysis of the indicated proinflammation cytokines (IL-1β, TNF-α, and IFN-γ) and master transcription factor associated with Th1 cells [T-bet(C)] in HUVECs stimulated with ox-LDL (10 μg/mL) in the presence or absence of Tim-3 (1,000 ng/L) or anti-Tim-3 mAb (10 μg/mL). Data represent mean ± SEM. *P ≤ 0.05, **P ≤ 0.01, and ***P < 0.001 compared with the control group. (D) In-Cell Western analysis (lower) and quantitation (upper) of the level of NF-κB phosphorylation in HUVECs stimulated with ox-LDL (10 μg/mL) for the indicated times (0, 15, 30, 60, 90, and 120 minutes). (E) In-Cell Western analysis (lower) and quantitation (upper) of phosphorylation/activation of NF-κB in HUVECs stimulated with ox-LDL (10 μg/mL) in the presence or absence of Tim-3 and the indicated inhibitors of JNK signal transduction, alone or together. (F) In-Cell Western analysis (lower) and quantitation (upper) of the level of JNK phosphorylation in HUVECs stimulated with ox-LDL (10 μg/mL) for the indicated times (0, 15, 30, 60, 90, 120 minutes). Data represent mean ± SEM. Images are representative of three independent experiments. *P ≤ 0.05, **P ≤ 0.01, and ***P < 0.001 compared with the control group.

