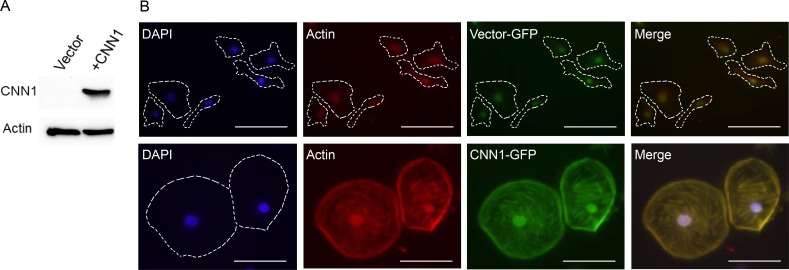
Figure 4. Overexpression of CNN1 in FE-RAS cells confers changes in cell morphology and cytoskeleton distribution.
(A) Western blot of CNN1 in FE-RAS cells transfected with vector and CNN1. (B) Immunofluorescence staining of FE-RAS cells transfected with GFP-vector control (upper panel) and GFP-CNN1 (bottom panel). Blue: DAPI. Red: Actin. Green: transfected GFP or GFP-CNN1. The Actin and CNN1 were colocalized in the overlapping field (yellow color). Scale bars: 50 μm. The cell margin was marked with dotted lines.

