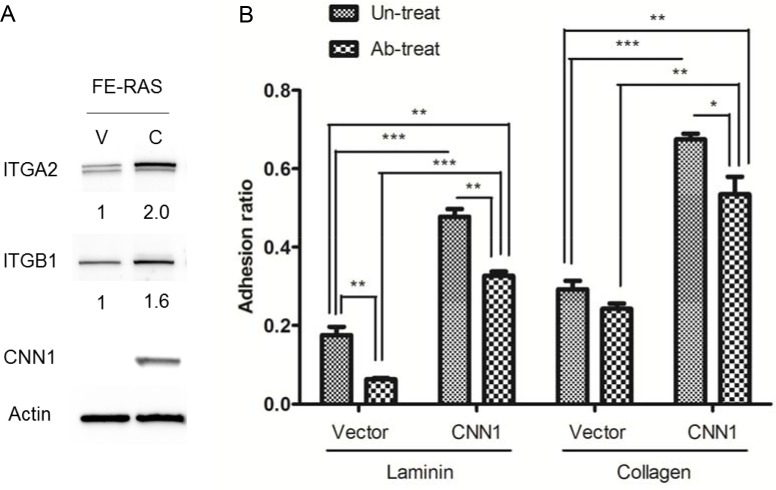
Figure 6. Expressions of integrin α2 (ITGA2) and β1 (ITGB1) correlate with CNN1 expression in cells and confer cell adhesion to different matrixes.
(A) ITGA2, ITGB1 and CNN1 expression level in FE-RAS cells transfected with control vector (clone #12, V) or CNN1 (clone #12, C). The number under each panel indicated the relative quantitation of the band density. (B) Cell adhesion assay of different transfectants: 1 × 10⁴ cells were seeded on the laminin- (left panel) or collagen- (right panel) coated well for 30 minutes with or without pre-treatment with integrin α2β1 antibody before seeding, and analyzed for cell adhesion. *p < 0.05, **p < 0.01, ***p < 0.001.

