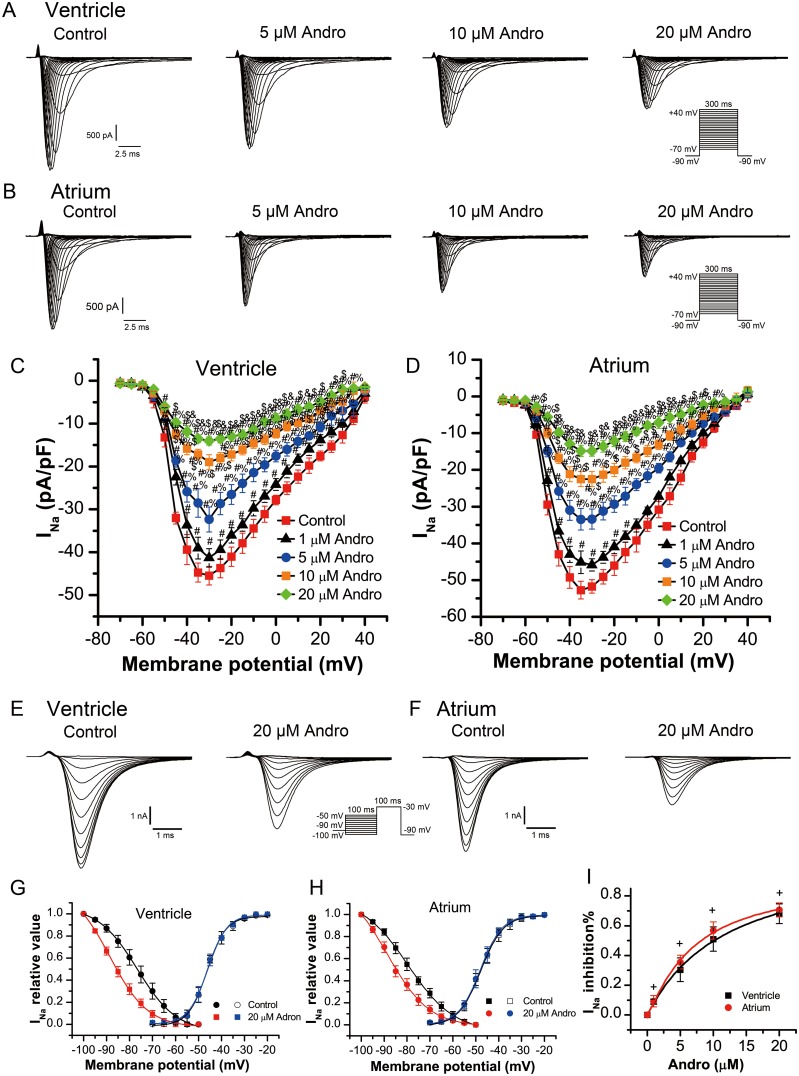
Figure 2. Andrographolide inhibited INa in a concentration dependent manner in LVMs and LAMs.
Representative whole-cell recordings of INa in LVMs (A) and LAMs (B) with or without 1, 5, 10, or 20 μM andrographolide. Current voltage relationships for INa in LVMs (C) and LAMs (D) Data are shown as means±SD (ventricle, n=10; atrium, n=8). #p<0.01 vs control, %p<0.01 vs 1 μM, $p<0.01 vs 5 μM, &p<0.01 vs 10 μM andrographolide. Representative INa recordings before (E) and after (F) andrographolide treatment using the inactivation protocol in the inset. Steady-state activation and inactivation curves for INa in LVMs (G) and LAMs (H) with or without 20 μM andrographolide. Lines represent data fit to a Boltzmann distribution function. Dose-reaction relationship between andrographolide and percent inhibition of INa (ventricle, n=10; atrium, n=10) (I)+p>0.05 vs ventricle.

