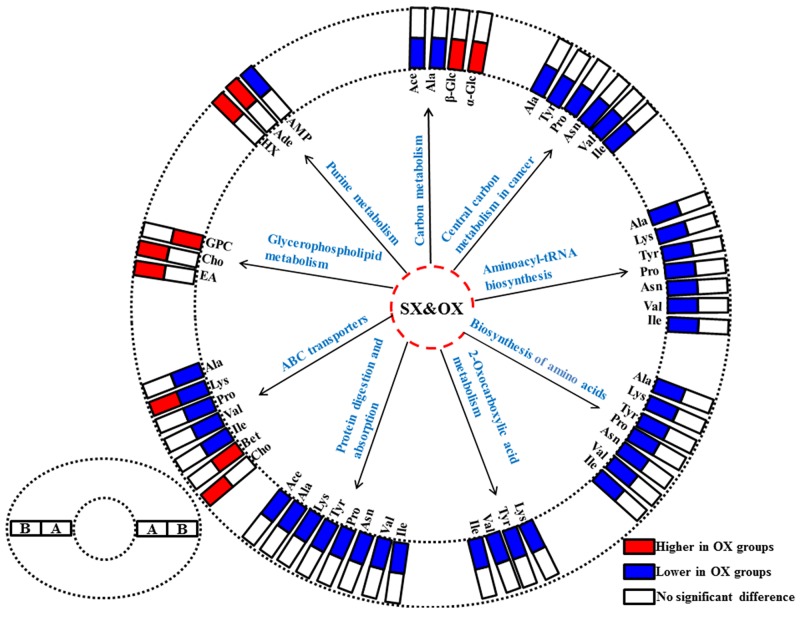
Figure 6. The differentiated metabolic pathways between subcutaneous and orthotopic xenograft groups based on the dominant metabolites in tissue metabonomes.
The pair-comparisons: (A), subcutaneous and orthotopic xenograft groups induced by Panc-1 cell; (B), subcutaneous and orthotopic xenograft groups induced by BxPC-3 cell. Abbreviations for the metabolites are listed in Table 1.

