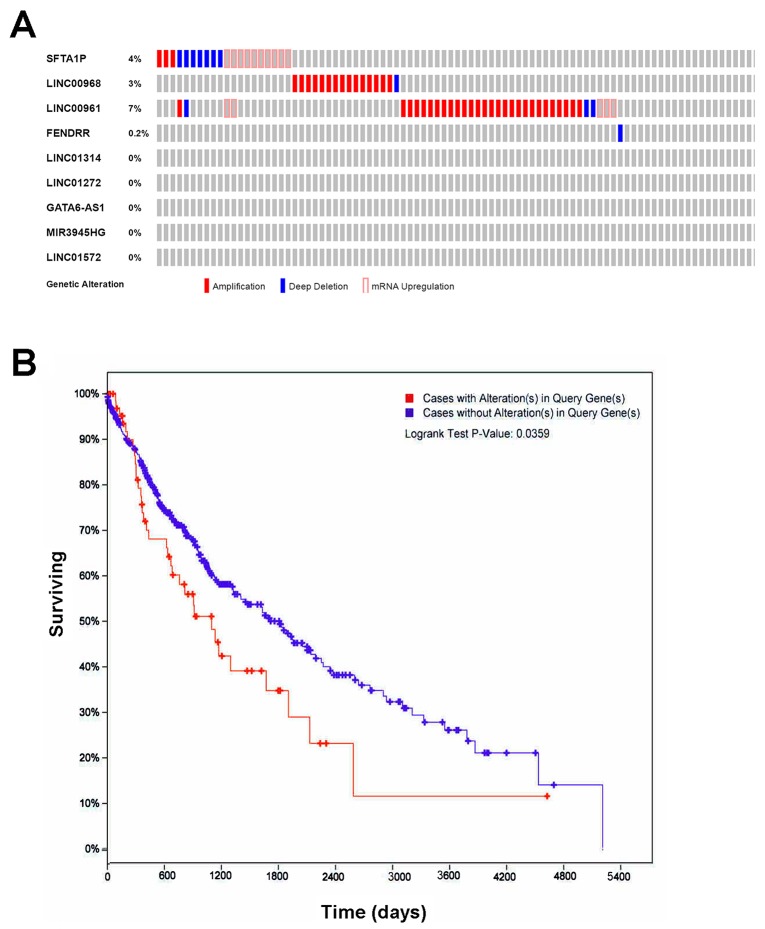
Figure 8. The genetic alterations and their prognostic value of the lncRNAs in LUSC.
(A) Genetic alterations. Red represents amplification, blue represents deep deletion and pink represents mRNA up-regulation. Genetic alterations were found in 69 of 501 LUSC patients (14%). The aberrant expression threshold was defined as z-score ± 2.0 from the TCGA RNA Seq V2 data. This OncoPrint was conducted by cBioPortal. (B) K-M curve between groups with alterations and without alterations. Red line represents cases with alterations, and blue line represents cases without. The X axis indicates overall survival time (days), and the Y axis indicates the survival rate. Kaplan-Meier test was performed. These curves were generated by cBioPortal.

