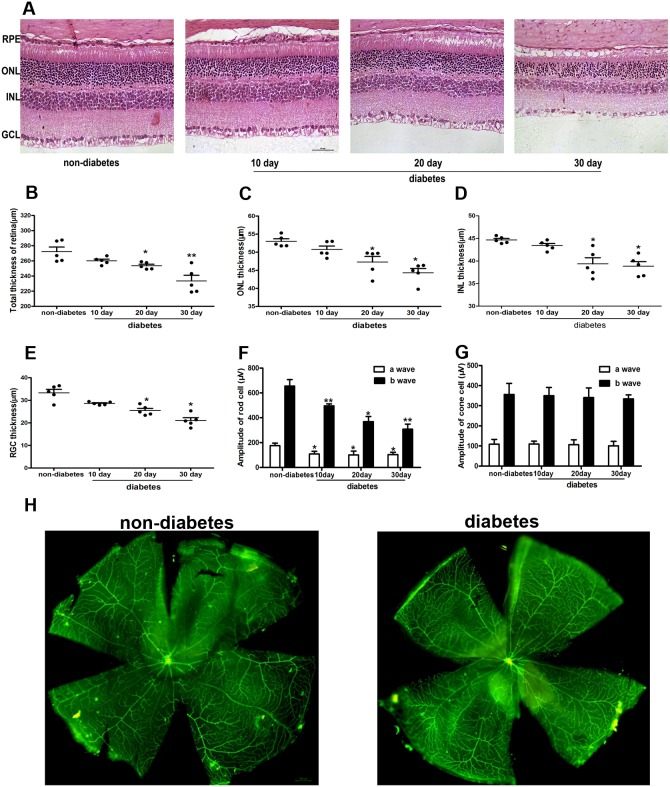
Figure 1. Morphological analysis of neuronal cells and vessels in the retina of diabetic mice.
(A) Morphological analysis of retina neuronal cells by H&E staining in diabetic mice. The thickness of the whole retina (B), ONL (C), INL (D), and RGC layer (E) in diabetic mice. (F)-(G) The functional analysis of the retina by ERG in diabetic mice. (H) Whole-mount retinas labeled with lectin-BS in diabetic mice. The data are presented as the mean ± SD. (n=5 in each group) * p<0.05, * * p<0.01.

