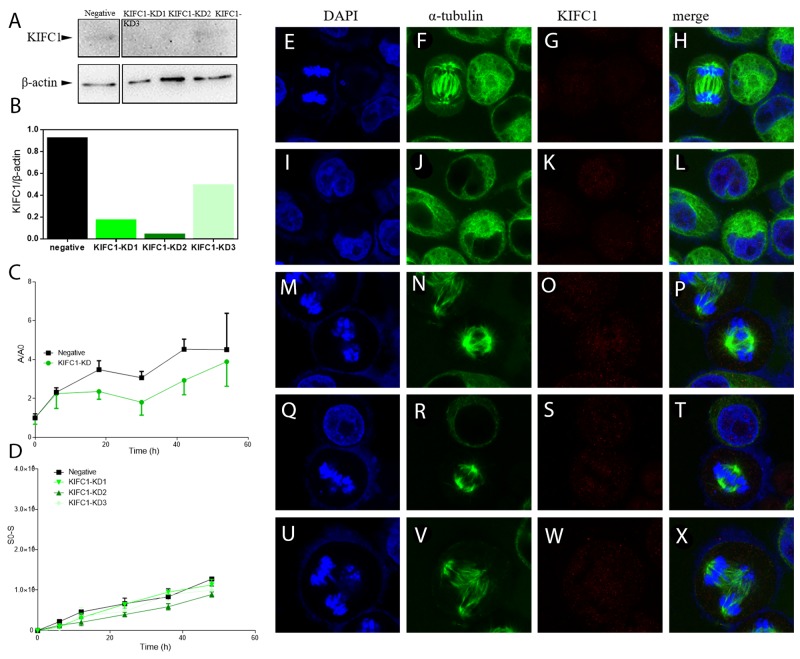
Figure 3. Knock down of KIFC1 in HeLa cells by RNAi.
(A) WB analysis of knock down efficiencies using three different sets of siRNA. (B) Localization of KIFC1 in HeLa cells determined by immuno-florescent staining. (C) Quantification of WB band intensity from (A). The knock down efficiency is as follows: KD2 > KD1 > KD3. (D) Growth curve of cells with KIFC1 knock down. The negative control is transfected with siRNA targeting GFP. A=A450-A650, and A0 represents the A value at the time point of 0. (E-X) Dynamic behavior of cells with different levels of KIFC1 knock down was determined by wound-healing assay.

