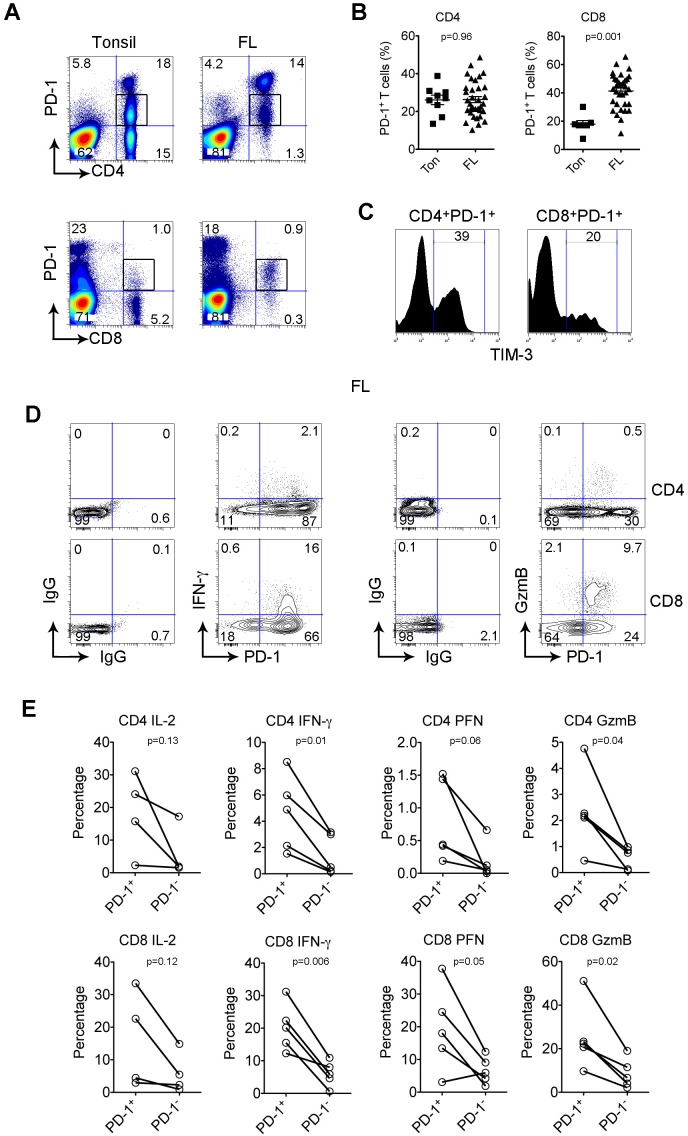
Figure 1. PD-1+ T population is expanded and functionally active in FL.
(A) PD-1 expression on CD4+ or CD8+ T cells from biopsy specimens of a FL patient (FL) and tonsil (Ton). Box is to indicate a PD-1+ T population exists in both the CD4+ and CD8+ subsets. (B) Graphs showing percentages of PD-1+ CD4+ or CD8+ T cells from tonsil and FL. (C) TIM-3 expression by PD-1+ CD4+ or CD8+ T cells. (D) IFN-γ and granzyme B (GzmB) on PD-1+CD4+ or CD8+ T cells from lymph nodes of FL patients. Isotype control staining was performed to determine PD-1+ T cells. (E) Graph summarizes percentages of IL-2, IFN-γ, perforin (PFN) and GzmB by PD-1+ and PD-1- in CD4+ and CD8+ T cells.

