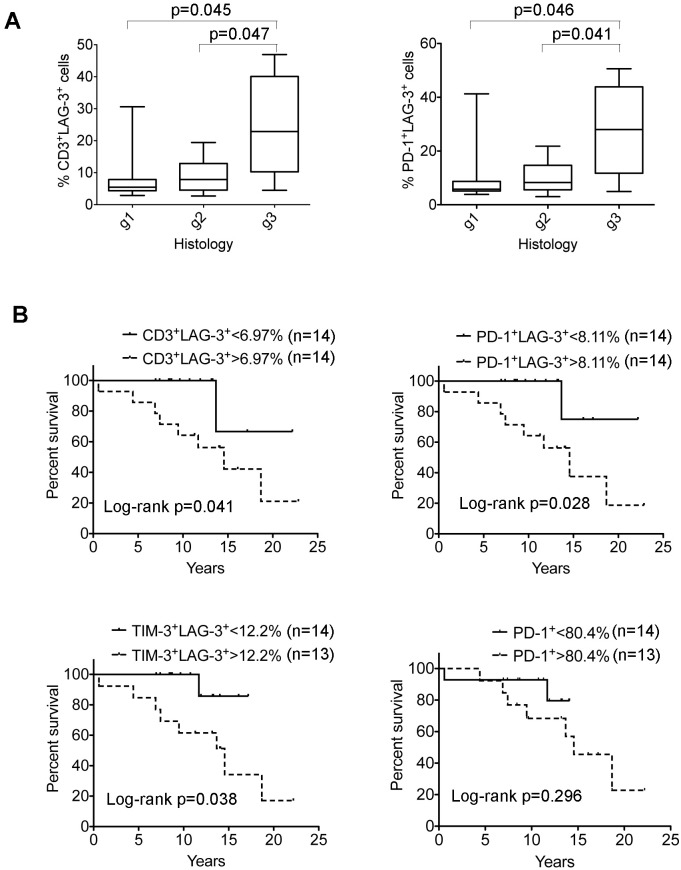
Figure 7. Correlation of LAG-3–expressing cells with clinical survival in FL patients.
(A) Correlation of the numbers of CD3+LAG-3+ cells (left) or PD-1+LAG-3+ (right) T cells with histological grade (g1-3) in FL patients (n = 28). (B) Kaplan-Meier curves for overall survival of FL patients (n = 28) by the number of CD3+LAG-3+ cells (upper left), PD-1+LAG-3+ T cells (upper right), TIM-3+LAG-3+ T cells (lower left) or PD-1+ T cells (lower right) with a cutoff of 6.97%, 8.11%, 12.2% or 80.4%, respectively.

